Fig. D.1
Download original image
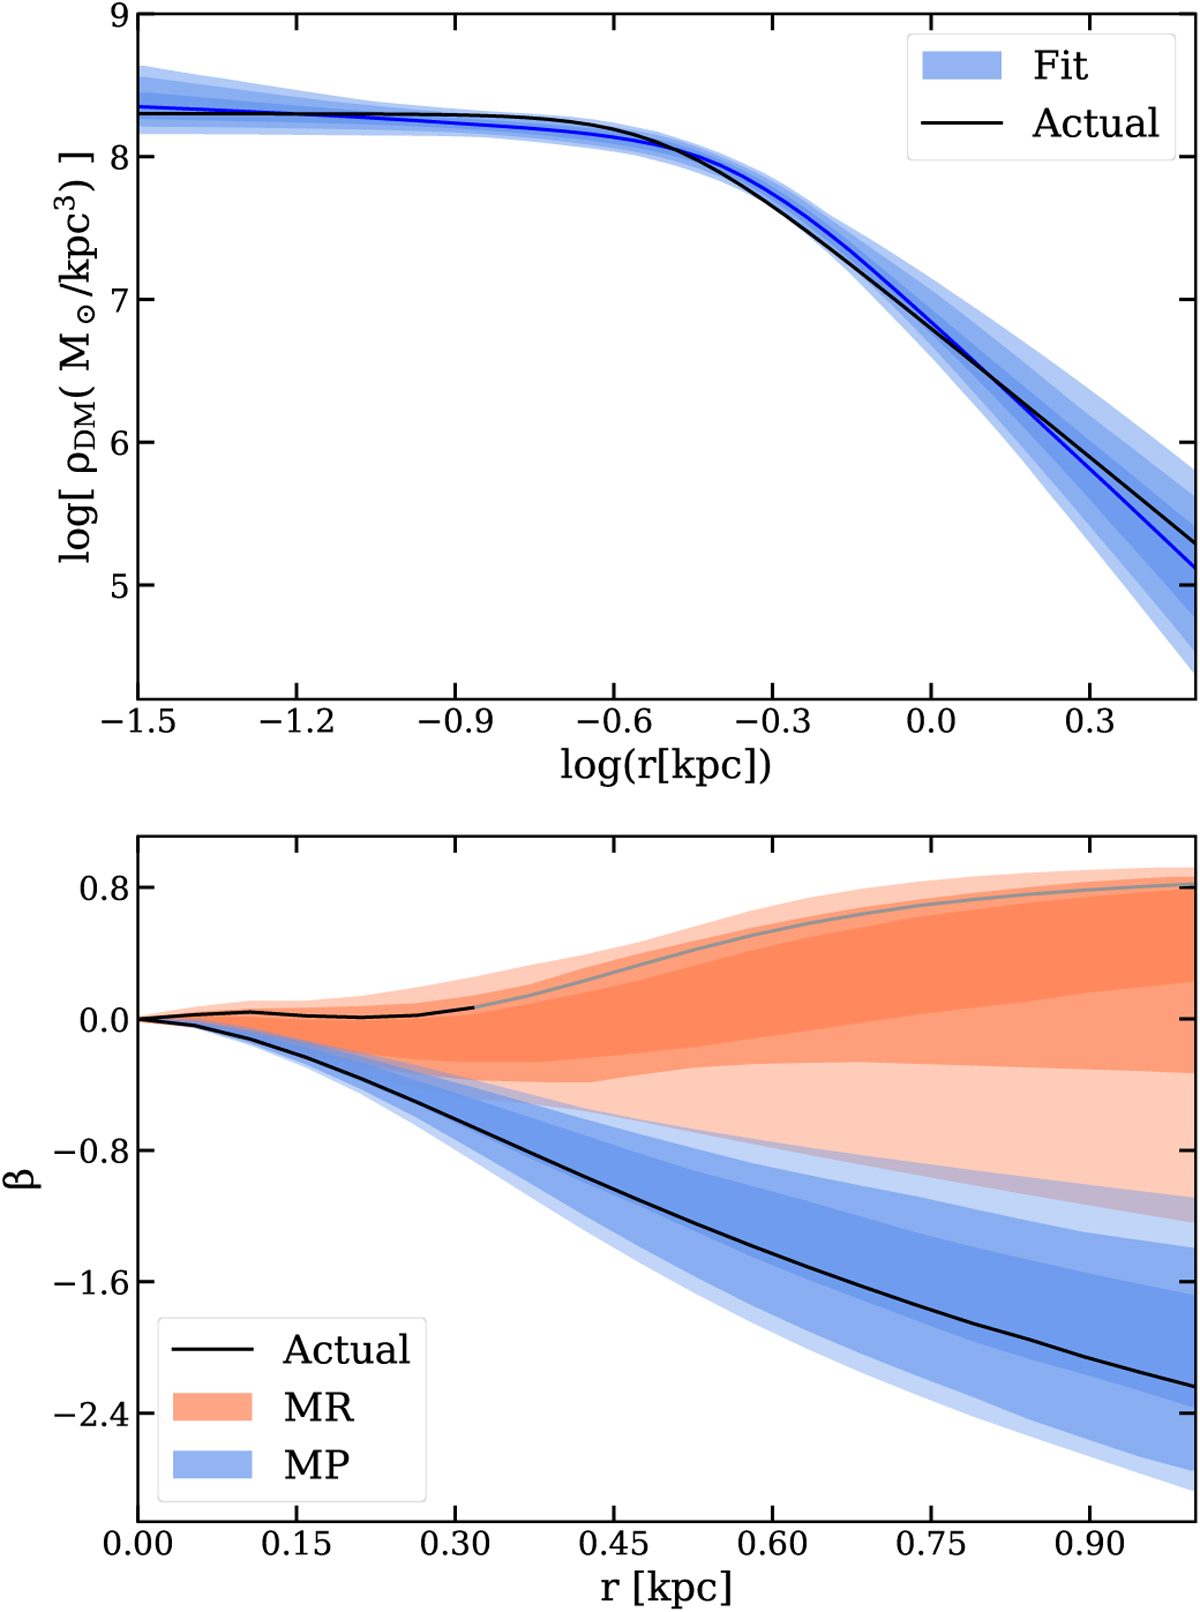
Upper panel: Dark matter density profile recovered for the cored mock galaxy. In black, we show the underlying one, the median of the predicted profile is shown with a solid blue line and the blue bands indicate the 1σ, 2σ and 3σ confidence intervals. Lower panel: Velocity anisotropy profile for the MP and MR stellar components. As solid lines, we show the values for the underlying model and in bands the best-fit for the MR and the MP component, indicating the 1σ, 2σ and 3σ confidence intervals. The solid black line corresponding to the MR component become gray in the region in which we do not produce stars that belong to that component.
Current usage metrics show cumulative count of Article Views (full-text article views including HTML views, PDF and ePub downloads, according to the available data) and Abstracts Views on Vision4Press platform.
Data correspond to usage on the plateform after 2015. The current usage metrics is available 48-96 hours after online publication and is updated daily on week days.
Initial download of the metrics may take a while.