Open Access
Fig. C.1
Download original image
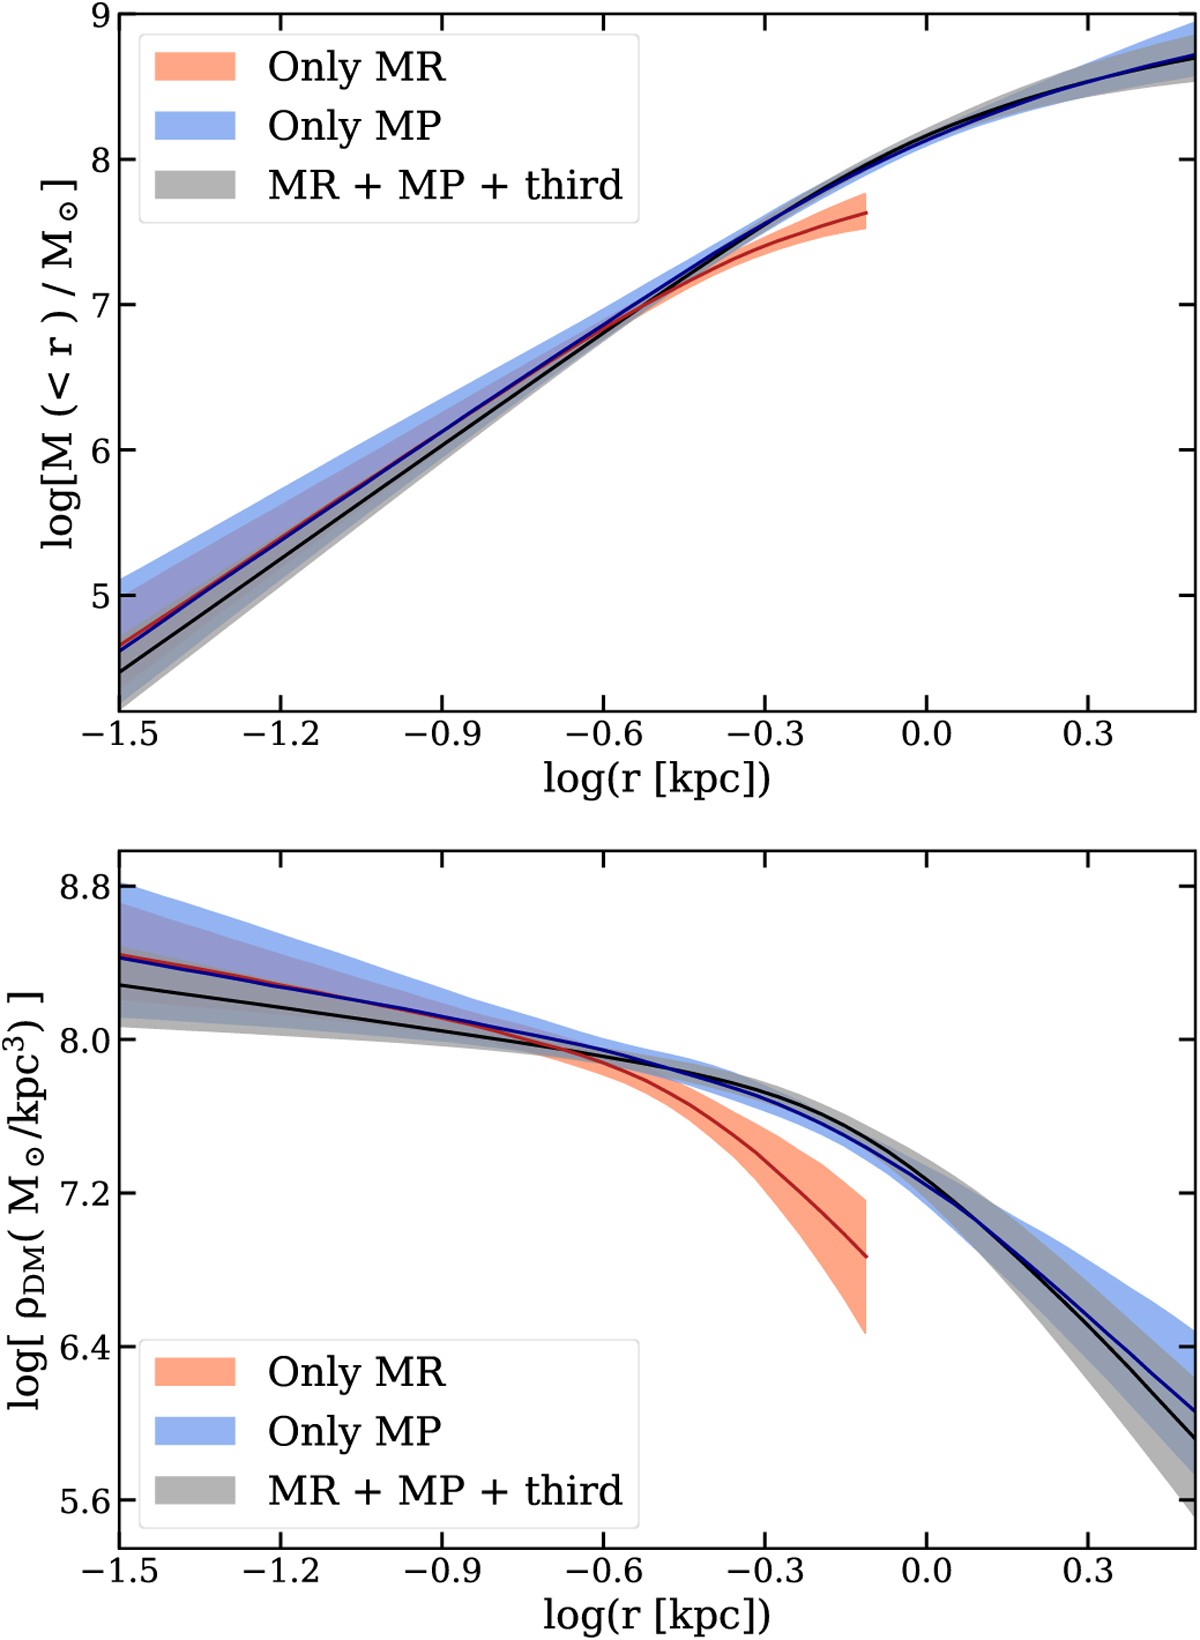
Upper panel: Cumulative DM halo mass distribution. Lower panel: DM halo density distribution. In different colors we show the inferred DM density profile obtained by using the two independent populations as tracers (black), only the MR population (red) and only the MP population (blue), as indicated in the legend.
Current usage metrics show cumulative count of Article Views (full-text article views including HTML views, PDF and ePub downloads, according to the available data) and Abstracts Views on Vision4Press platform.
Data correspond to usage on the plateform after 2015. The current usage metrics is available 48-96 hours after online publication and is updated daily on week days.
Initial download of the metrics may take a while.