Fig. 1

Download original image
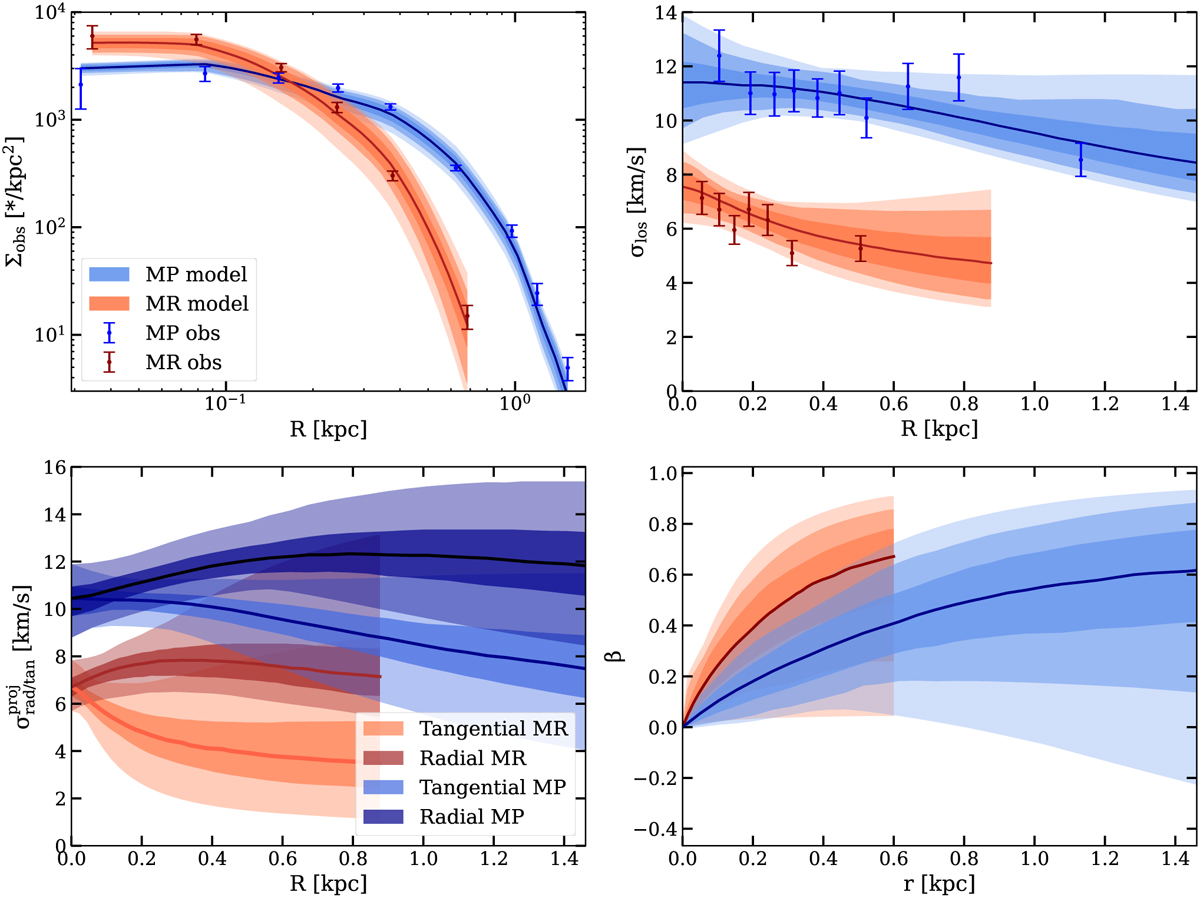
Comparison between the median models of the MP and MR populations of Sculptor and the observed binned data from AP24. Points indicate the observed data with the bars indicating 1σ uncertainties, the solid lines the median models and the colored bands the 1σ, 2σ, and 3σ ranges. The MP and MR components are shown in blue and red, respectively, as indicated in the legend. Upper-left panel: observed surface density profiles. Upper-right panel: line-of-sight velocity dispersion profiles. Lower-left panel: radial and tangential projected velocity dispersion profiles. Only 1σ and 3σ bands are shown for simplicity. Lower-right panel: 3D velocity anisotropy profiles.
Current usage metrics show cumulative count of Article Views (full-text article views including HTML views, PDF and ePub downloads, according to the available data) and Abstracts Views on Vision4Press platform.
Data correspond to usage on the plateform after 2015. The current usage metrics is available 48-96 hours after online publication and is updated daily on week days.
Initial download of the metrics may take a while.


