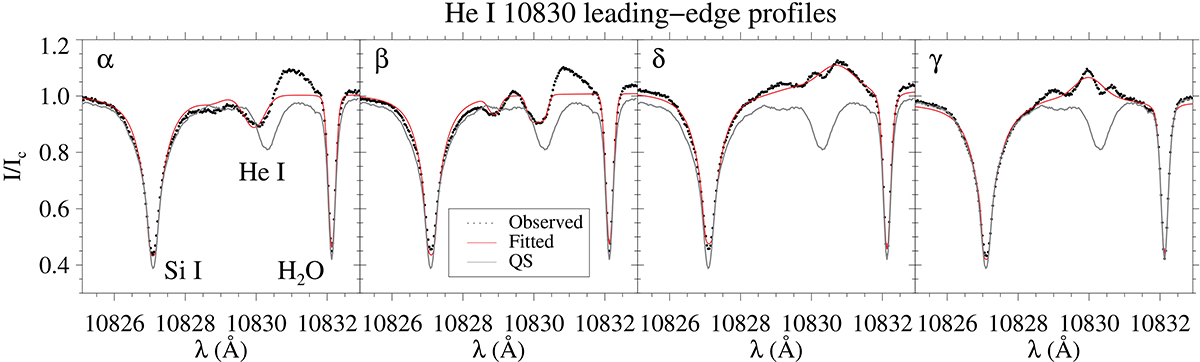
Fig. 7.
Download original image
Examples of He I 10830 Å intensity profiles found at the leading front of the flare ribbon. The dots represent the observed profiles and the red solid line is the fit from the HAZEL inversions. The quiet-Sun profile, which is at rest, is shown in gray to better identify the Doppler shifts. The positions of the four profiles (α, β, δ, and γ) appear in Fig. 5; the inferred velocities are −10.0, −5.8, 10.9, and −9.1 km s−1, respectively. In panel α, the absorption seen in He I is the blueshifted component, whereas the He I emission profile is the redshifted component.
Current usage metrics show cumulative count of Article Views (full-text article views including HTML views, PDF and ePub downloads, according to the available data) and Abstracts Views on Vision4Press platform.
Data correspond to usage on the plateform after 2015. The current usage metrics is available 48-96 hours after online publication and is updated daily on week days.
Initial download of the metrics may take a while.