Fig. 6.
Download original image
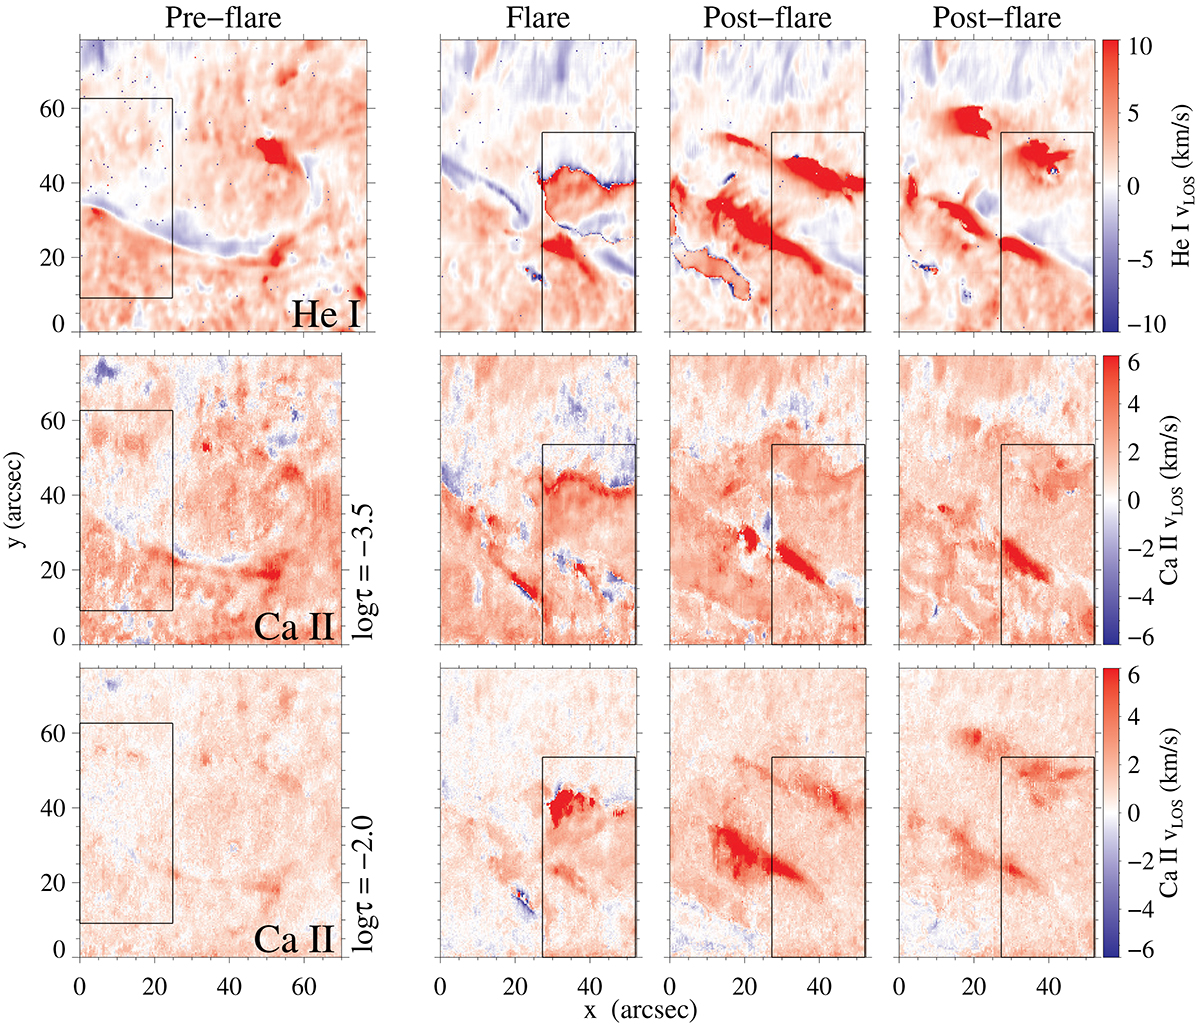
LOS velocities at different times of the flare inferred from the inversions. From top to bottom: He I 10830 Å, Ca II 8542 Å at log τ=−3.5, and log τ=−2.0. The first column of velocity maps corresponds to the pre-flare phase (07:49–08:29 UT). The second column shows the peak of the flare (08:35–09:05 UT). The third and fourth columns depict the post-flare phases corresponding to the time ranges (09:07–09:36 UT) and (09:38–10:08 UT), respectively. We note that the top panels corresponding to the He I LOS velocities are clipped between ±10 km s−1, whereas the middle and lower panels of Ca II LOS velocities are saturated between ±6 km s−1. The black box shows the common FOV among all raster scans.
Current usage metrics show cumulative count of Article Views (full-text article views including HTML views, PDF and ePub downloads, according to the available data) and Abstracts Views on Vision4Press platform.
Data correspond to usage on the plateform after 2015. The current usage metrics is available 48-96 hours after online publication and is updated daily on week days.
Initial download of the metrics may take a while.