Fig. 5.
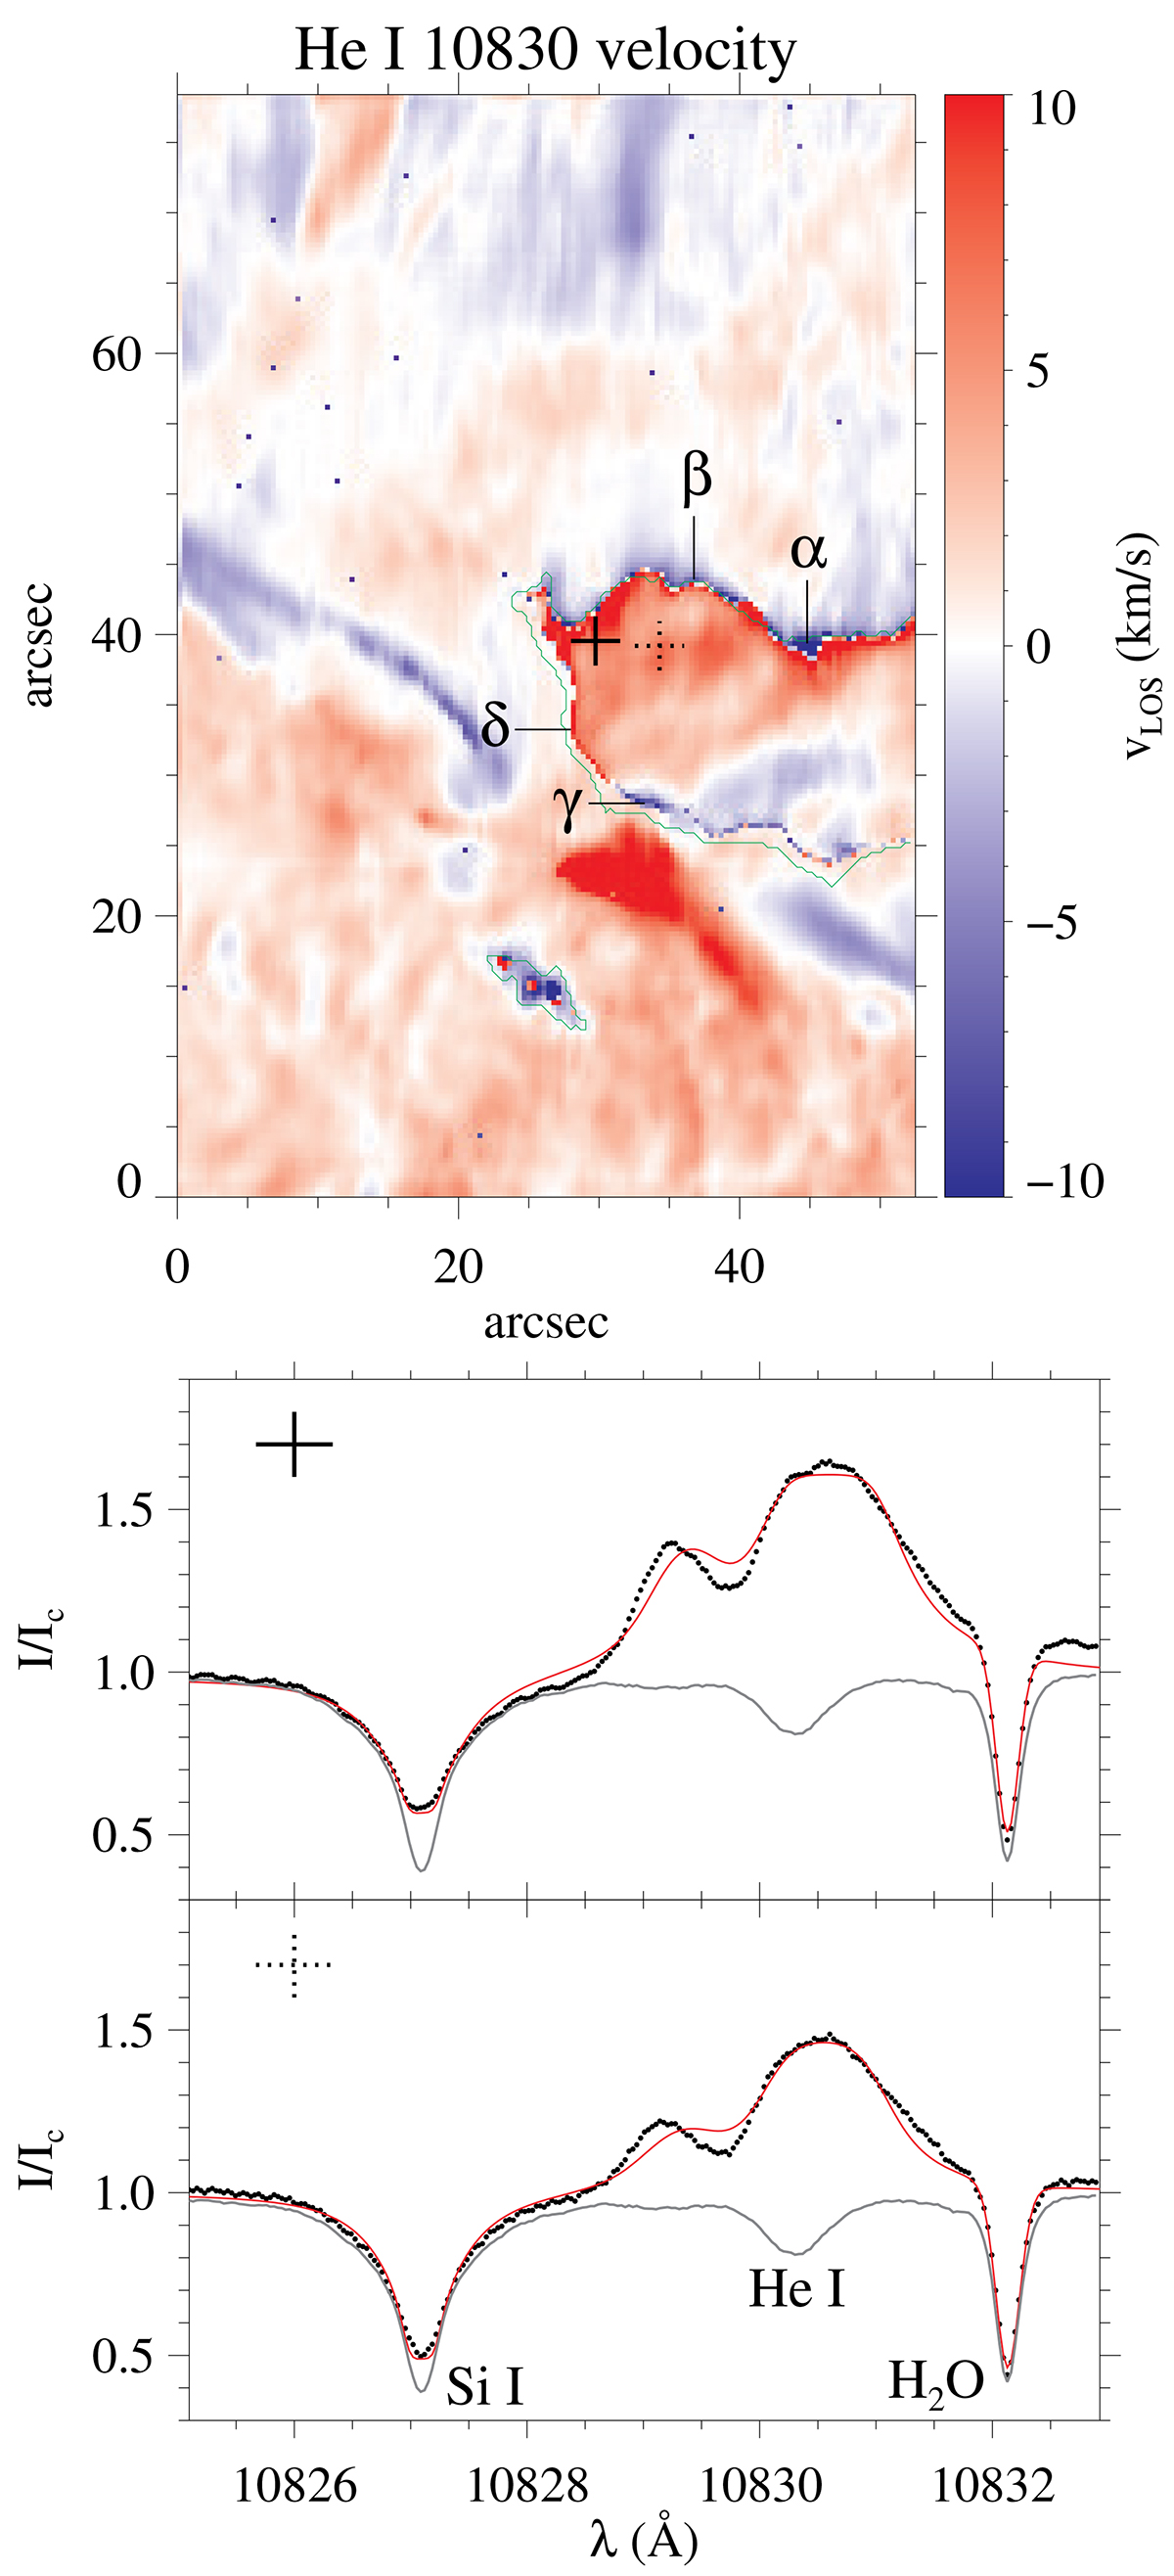
Download original image
Top: Slit-reconstructed LOS velocity map of the flare inferred from the He I 10830 Å inversions using HAZEL. The map is clipped between ±10 km s−1. Flows directed away (toward) the observer are shown in red (blue; see color bar at right). The faint green contour marks the borders of the ribbons, as seen in Fig. 1b), using an intensity threshold at I/Ic = 0.87. Bottom: Two example intensity profiles observed within the flaring area. The black dots are the observations, whereas the red solid line depicts the fit from the HAZEL inversion. The two profiles are marked in the velocity map (top panel) with a solid and a dotted cross; the profiles correspond to an inferred velocity of 8.0 and 6.9 km s−1, respectively, retrieved from the He I fit. The solid gray line shows the average quiet-Sun profile. The letters α−γ show the positions of the leading-edge profiles exhibited in Fig. 7.
Current usage metrics show cumulative count of Article Views (full-text article views including HTML views, PDF and ePub downloads, according to the available data) and Abstracts Views on Vision4Press platform.
Data correspond to usage on the plateform after 2015. The current usage metrics is available 48-96 hours after online publication and is updated daily on week days.
Initial download of the metrics may take a while.