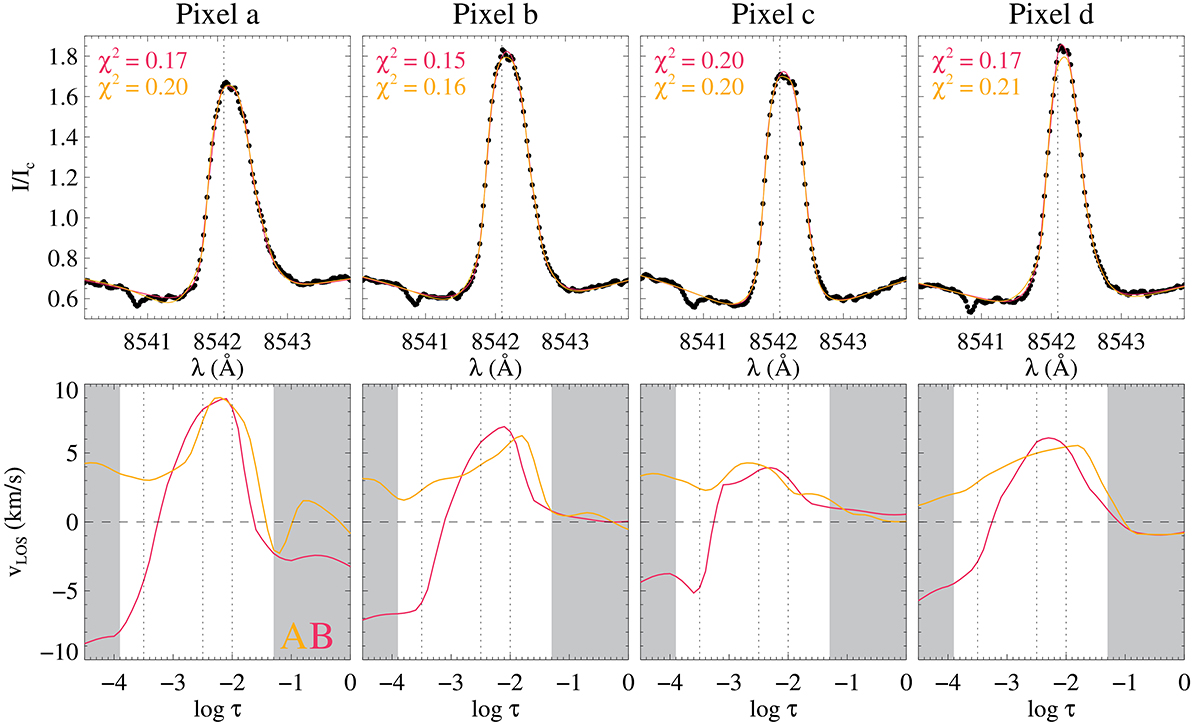
Fig. 4.
Download original image
Selected Ca II 8542 Å profiles from the flare-front ribbon and inferred LOS velocity stratification. Top: Observed Ca II intensity profiles (black dots); fit from the inversions using two different inversion configurations (pink and orange lines; Table 1). The χ2-test shows similar values for both fits. The vertical dotted line marks the center of the Ca II line at rest. Bottom: Inferred LOS velocity stratification with height on an optical depth scale. The orange (pink) line corresponds to configuration A (B) of the inversion (see Table 1). The vertical dotted lines mark the three optical depths shown in Fig. 3. The position of the pixels within the FOV is represented in panel f) of Fig. 1. The velocities shown inside the shaded area are not trustworthy, as the RF is very low in that area.
Current usage metrics show cumulative count of Article Views (full-text article views including HTML views, PDF and ePub downloads, according to the available data) and Abstracts Views on Vision4Press platform.
Data correspond to usage on the plateform after 2015. The current usage metrics is available 48-96 hours after online publication and is updated daily on week days.
Initial download of the metrics may take a while.