Fig. 3.
Download original image
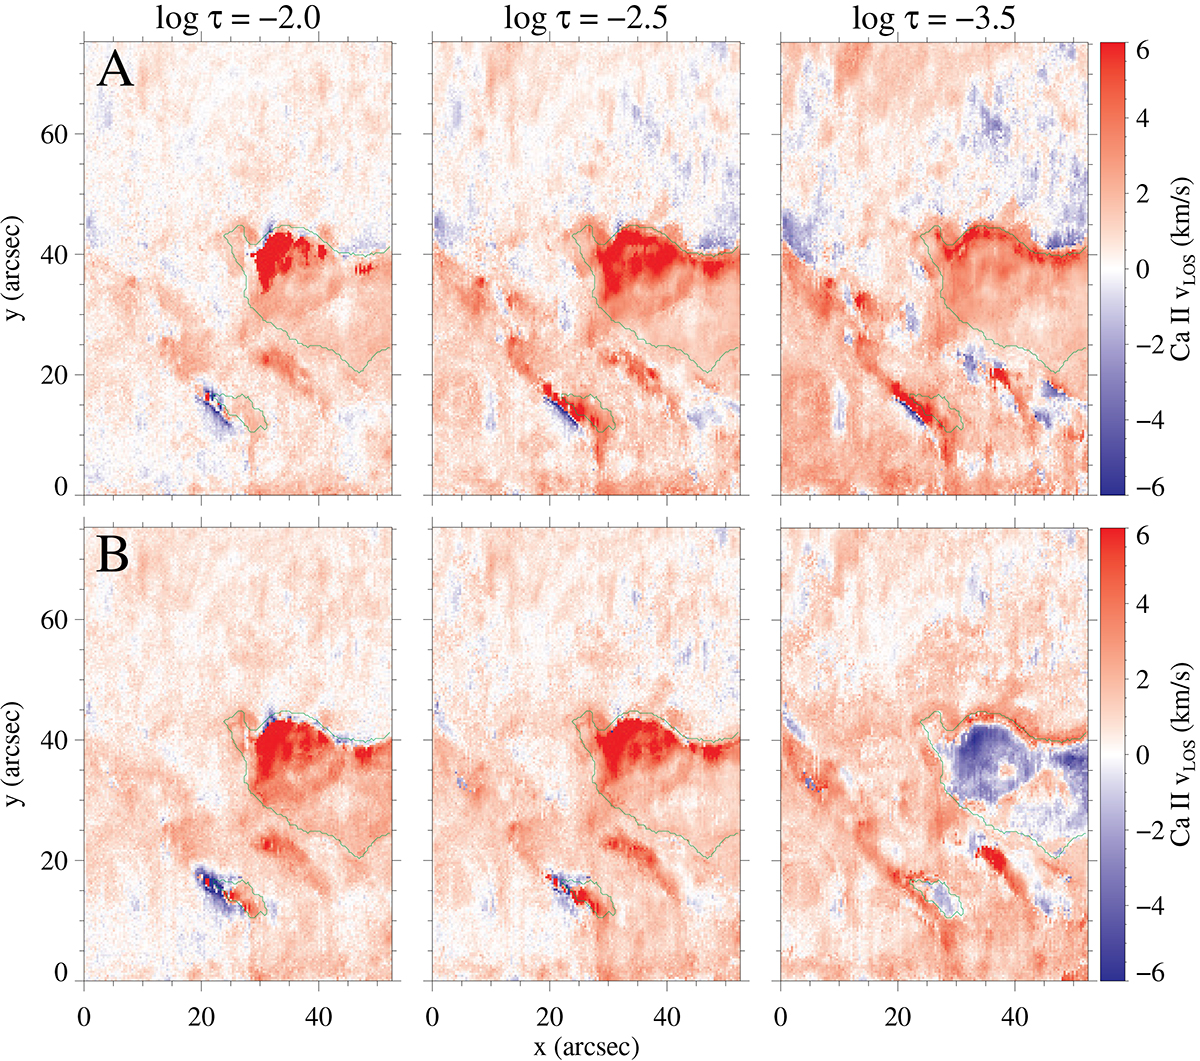
Comparison of the Ca II 8542 Å LOS velocities at different optical depths, using two different inversion strategies with STiC (see Table 1) during the M-class flare (map 2 or panel f) in Fig. 1). Top (A): Restrictions applied to the inversion code. Bottom (B): Solution leaving the code with more freedom. The velocities are clipped between ±6 km s−1. The faint green contours mark the borders of the ribbons as seen in Fig. 1f), using an intensity threshold at I/Ic = 0.87.
Current usage metrics show cumulative count of Article Views (full-text article views including HTML views, PDF and ePub downloads, according to the available data) and Abstracts Views on Vision4Press platform.
Data correspond to usage on the plateform after 2015. The current usage metrics is available 48-96 hours after online publication and is updated daily on week days.
Initial download of the metrics may take a while.