Fig. 2.
Download original image
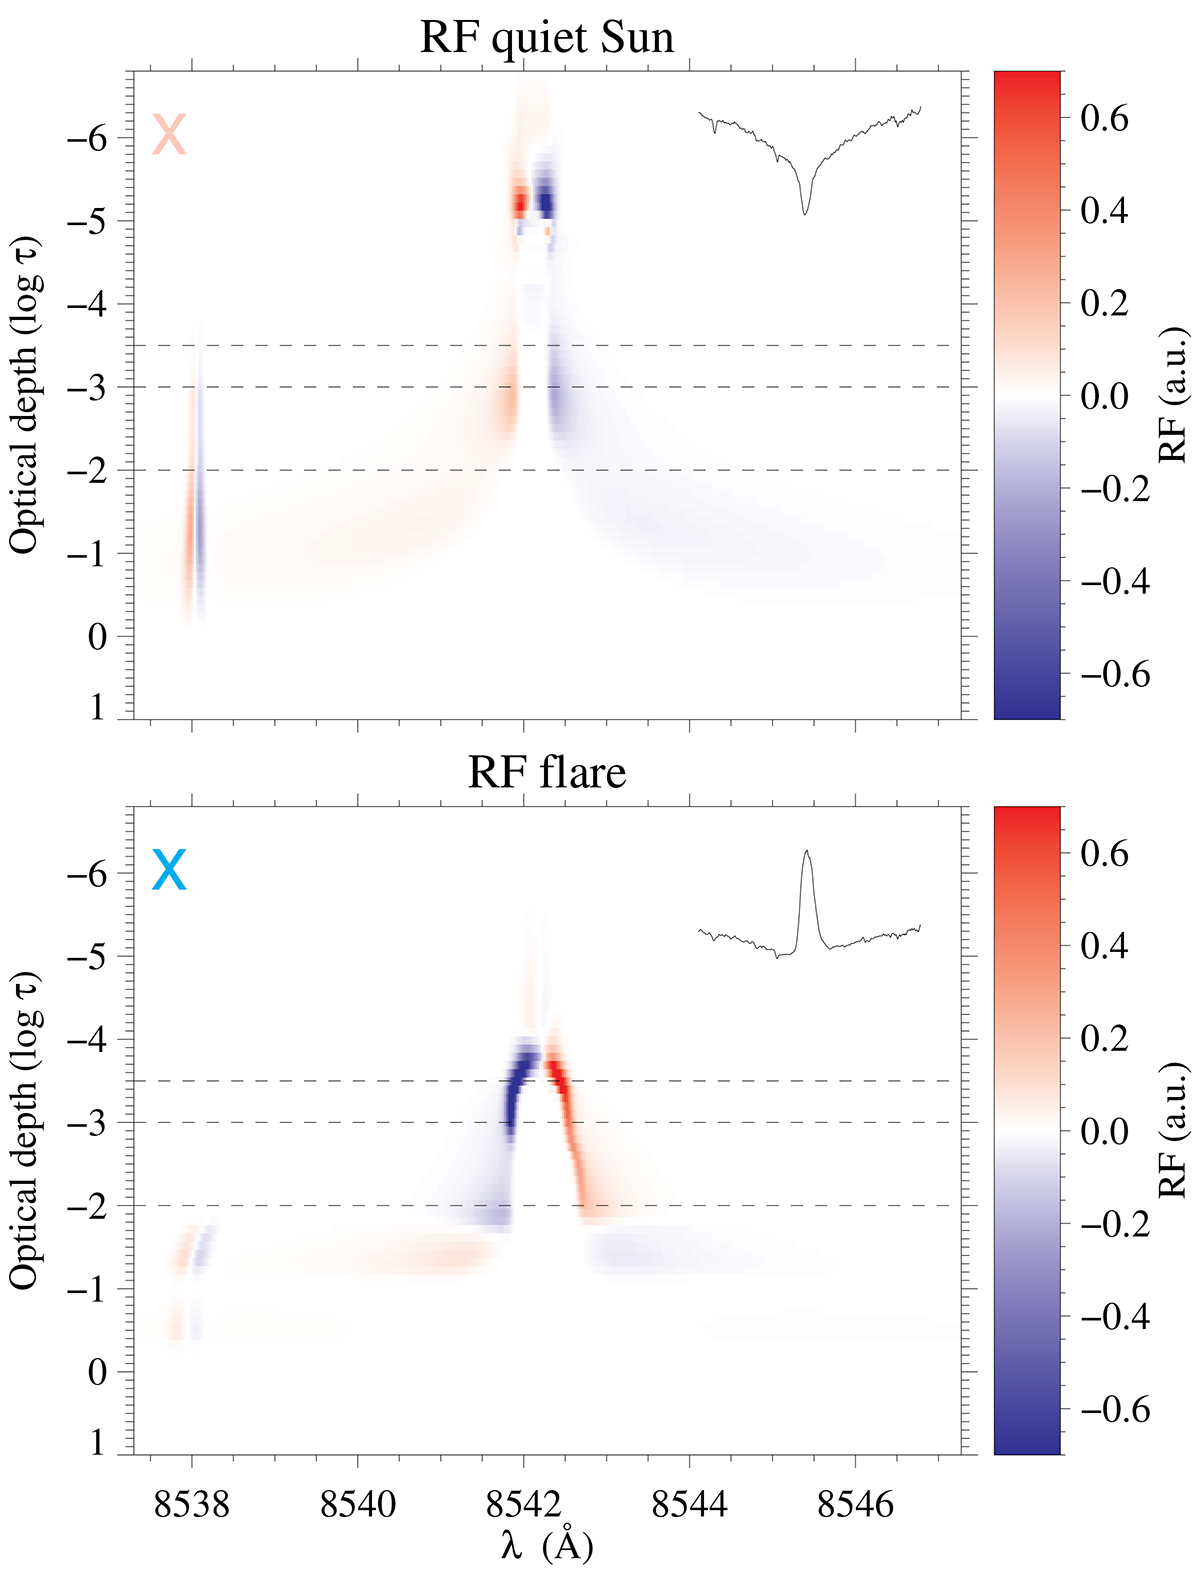
Response functions of the Ca II 8542 Å spectral line to changes in the LOS velocity. The lower panel corresponds to a pixel within the bright flare, at the ribbon front at coordinates ![]() (see light blue cross in Fig. 1f), whereas the upper panel shows the RF in a quiet-Sun pixel (pink cross in Fig. 1f at
(see light blue cross in Fig. 1f), whereas the upper panel shows the RF in a quiet-Sun pixel (pink cross in Fig. 1f at ![]() ). The RFs are normalized to their maximum absolute value and saturated between ±0.7 to enhance the weaker areas. The corresponding observed intensity profile is shown in the upper right corner of each panel and extends over the same spectral range as the RF. The horizontal dashed lines mark the optical depths at log τ=−2.0, −3.0, and −3.5.
). The RFs are normalized to their maximum absolute value and saturated between ±0.7 to enhance the weaker areas. The corresponding observed intensity profile is shown in the upper right corner of each panel and extends over the same spectral range as the RF. The horizontal dashed lines mark the optical depths at log τ=−2.0, −3.0, and −3.5.
Current usage metrics show cumulative count of Article Views (full-text article views including HTML views, PDF and ePub downloads, according to the available data) and Abstracts Views on Vision4Press platform.
Data correspond to usage on the plateform after 2015. The current usage metrics is available 48-96 hours after online publication and is updated daily on week days.
Initial download of the metrics may take a while.