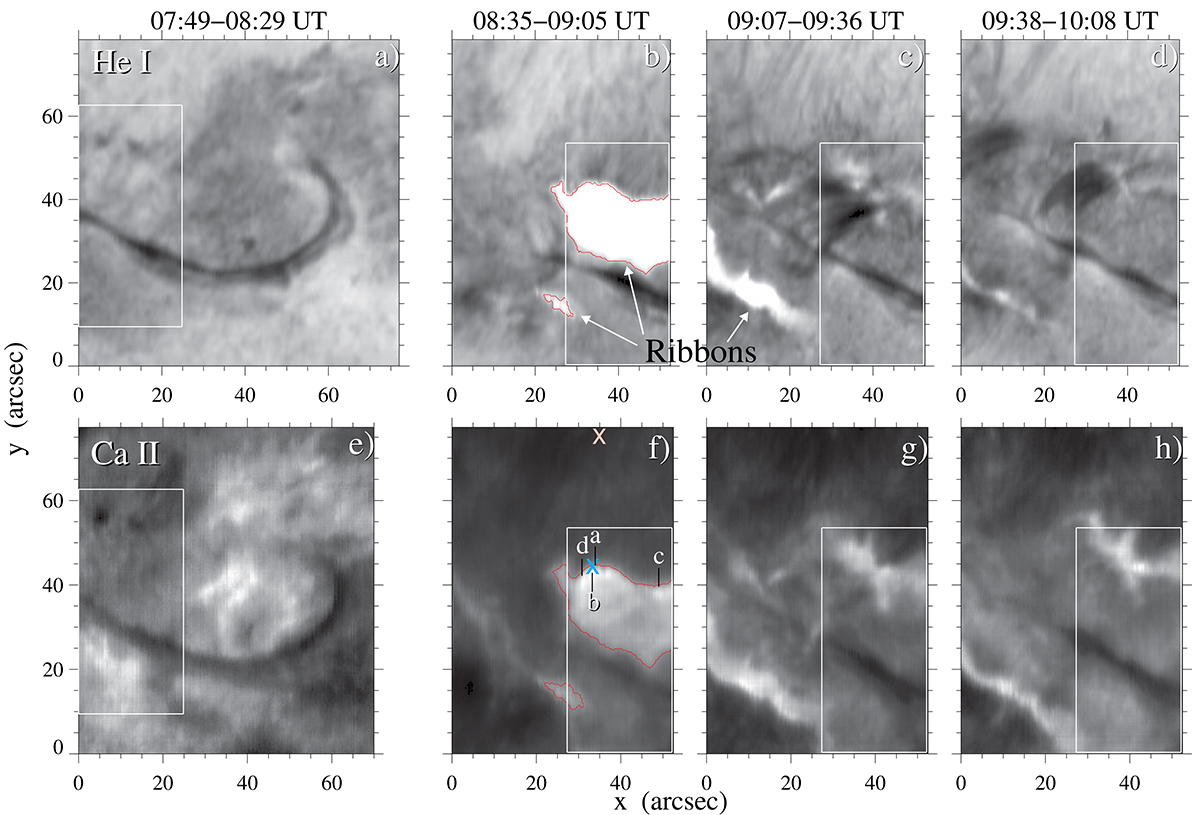
Fig. 1.
Download original image
Slit-reconstructed images of the four raster scans centered at the He I line core of the red component (upper row) and the Ca II line core (lower row). From left to right: pre-flare (panels a and e), flare (panels b and f), and post-flare maps (panels c, d, g, and h). The white box shows the common FOV among all raster scans. The letters a–d in panel f mark the position of the pixels shown in Fig. 4. The light blue and pink crosses in panel f mark the positions of the response functions shown in Fig. 2. The red contours mark the borders of the flare ribbons in panels b and f, using an intensity threshold of I/Ic = 0.87 in the line core.
Current usage metrics show cumulative count of Article Views (full-text article views including HTML views, PDF and ePub downloads, according to the available data) and Abstracts Views on Vision4Press platform.
Data correspond to usage on the plateform after 2015. The current usage metrics is available 48-96 hours after online publication and is updated daily on week days.
Initial download of the metrics may take a while.