Fig. 5
Download original image
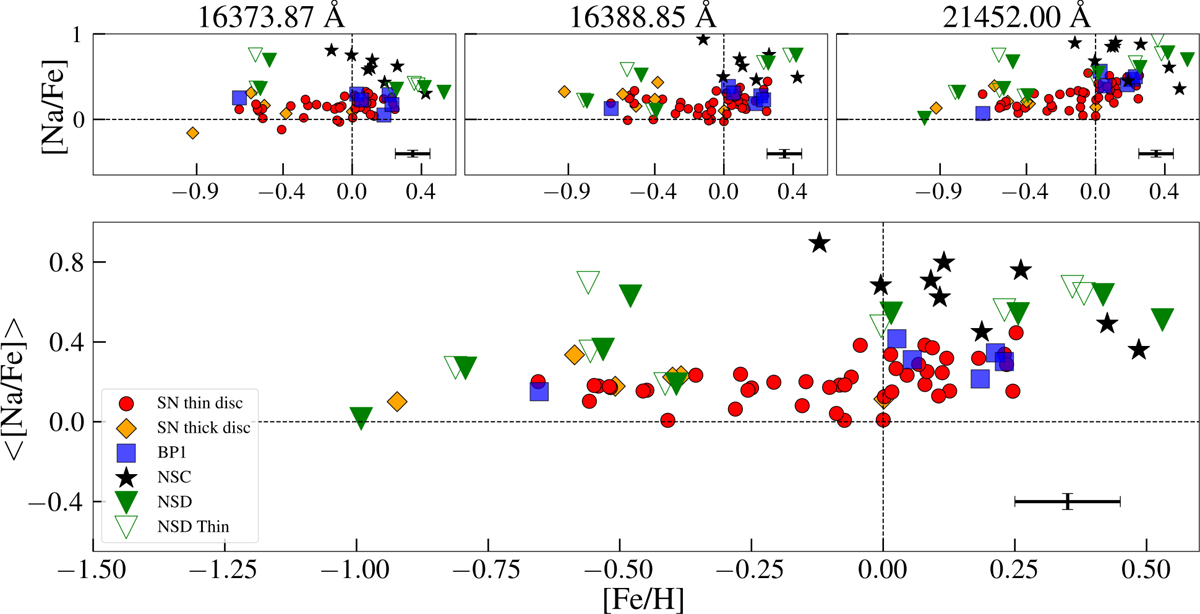
[Na/Fe] vs [Fe/H] for different stellar populations. The NSD stars are represented by green open and filled triangles, NSC stars by black stars, inner bulge stars by blue squares, solar neighbourhood thin-disc stars by red filled circles, and thick-disc stars by orange diamonds. Upper panels: trends from the individual spectral lines used in the analysis. Lower panel: mean trend. Not all three lines were usable for every star. The green open triangles (denoted ‘NSD Thin’) represent the abundances for the NSD stars determined using alternative stellar parameters with the assumption that oxygen abundances follow the thin-disc trend, indicating typical uncertainties.
Current usage metrics show cumulative count of Article Views (full-text article views including HTML views, PDF and ePub downloads, according to the available data) and Abstracts Views on Vision4Press platform.
Data correspond to usage on the plateform after 2015. The current usage metrics is available 48-96 hours after online publication and is updated daily on week days.
Initial download of the metrics may take a while.