Fig. 5
Download original image
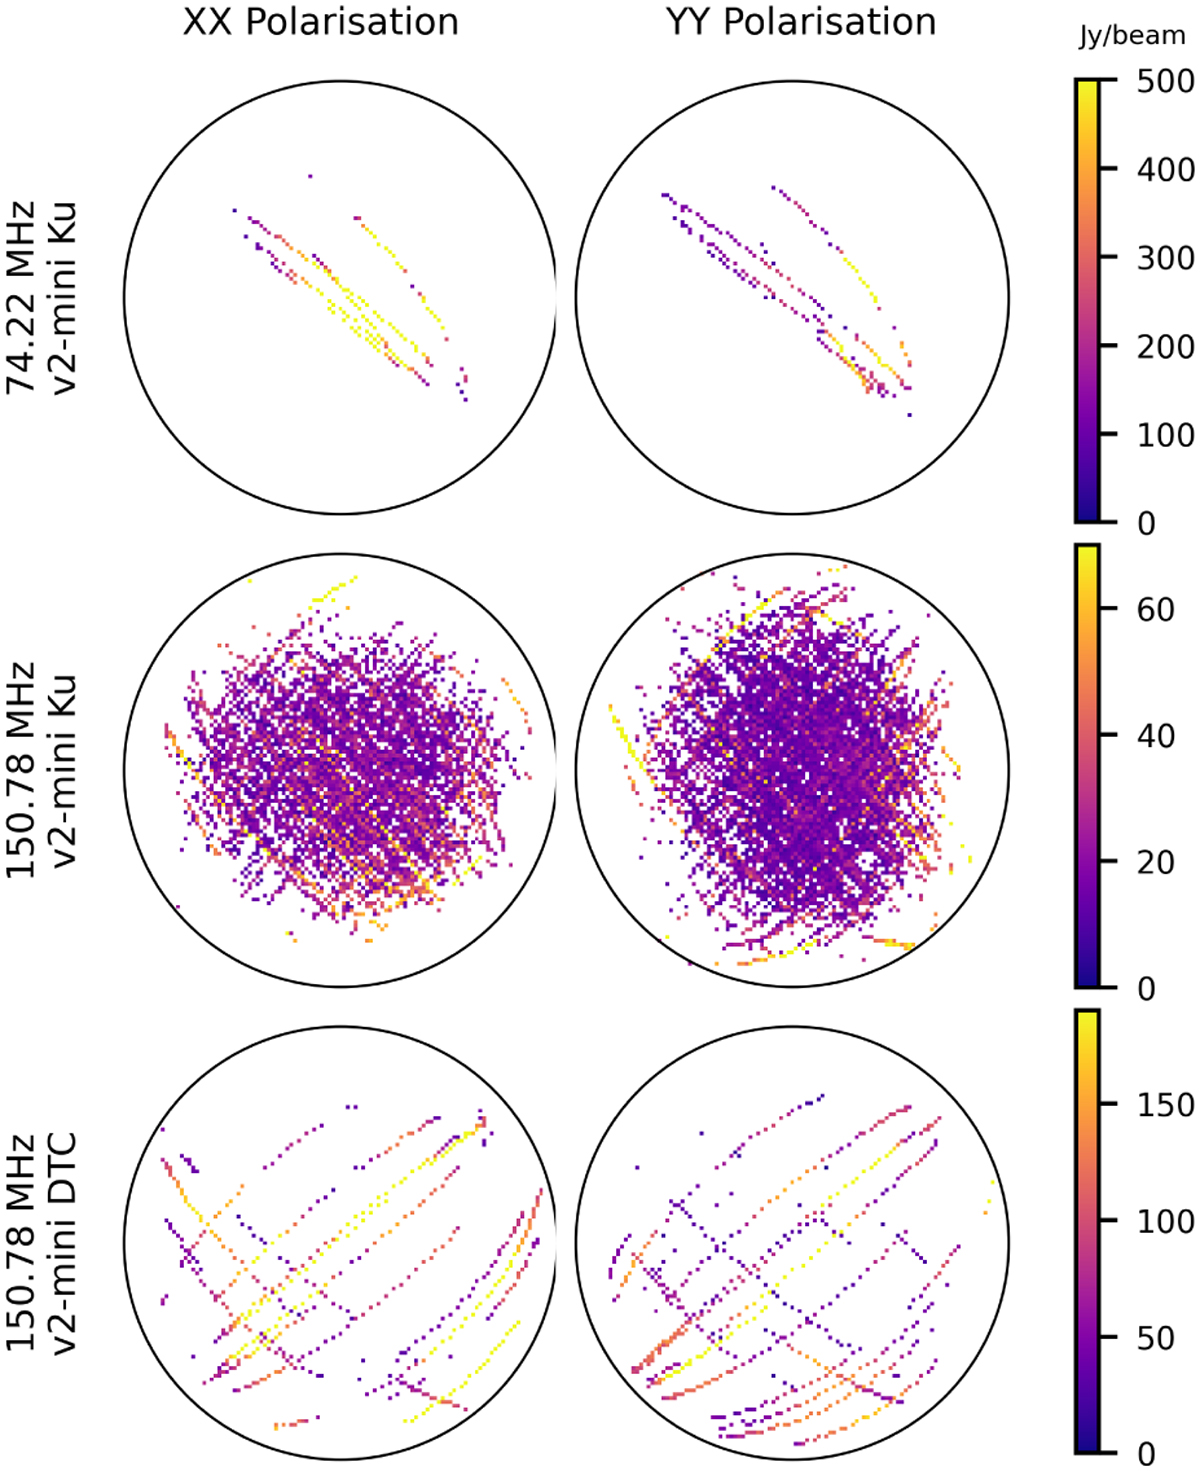
Flux density, as a function of position on the sky relative to EDA2, for all Starlink satellites of a given model at a given frequency. The flux densities are from identifications of the satellites in images with all frequency channels averaged – resulting in a 0.926 MHz band-width. The black circle surrounding each plot is the 20° elevation isobar on the sky.
Current usage metrics show cumulative count of Article Views (full-text article views including HTML views, PDF and ePub downloads, according to the available data) and Abstracts Views on Vision4Press platform.
Data correspond to usage on the plateform after 2015. The current usage metrics is available 48-96 hours after online publication and is updated daily on week days.
Initial download of the metrics may take a while.