Fig. 3

Download original image
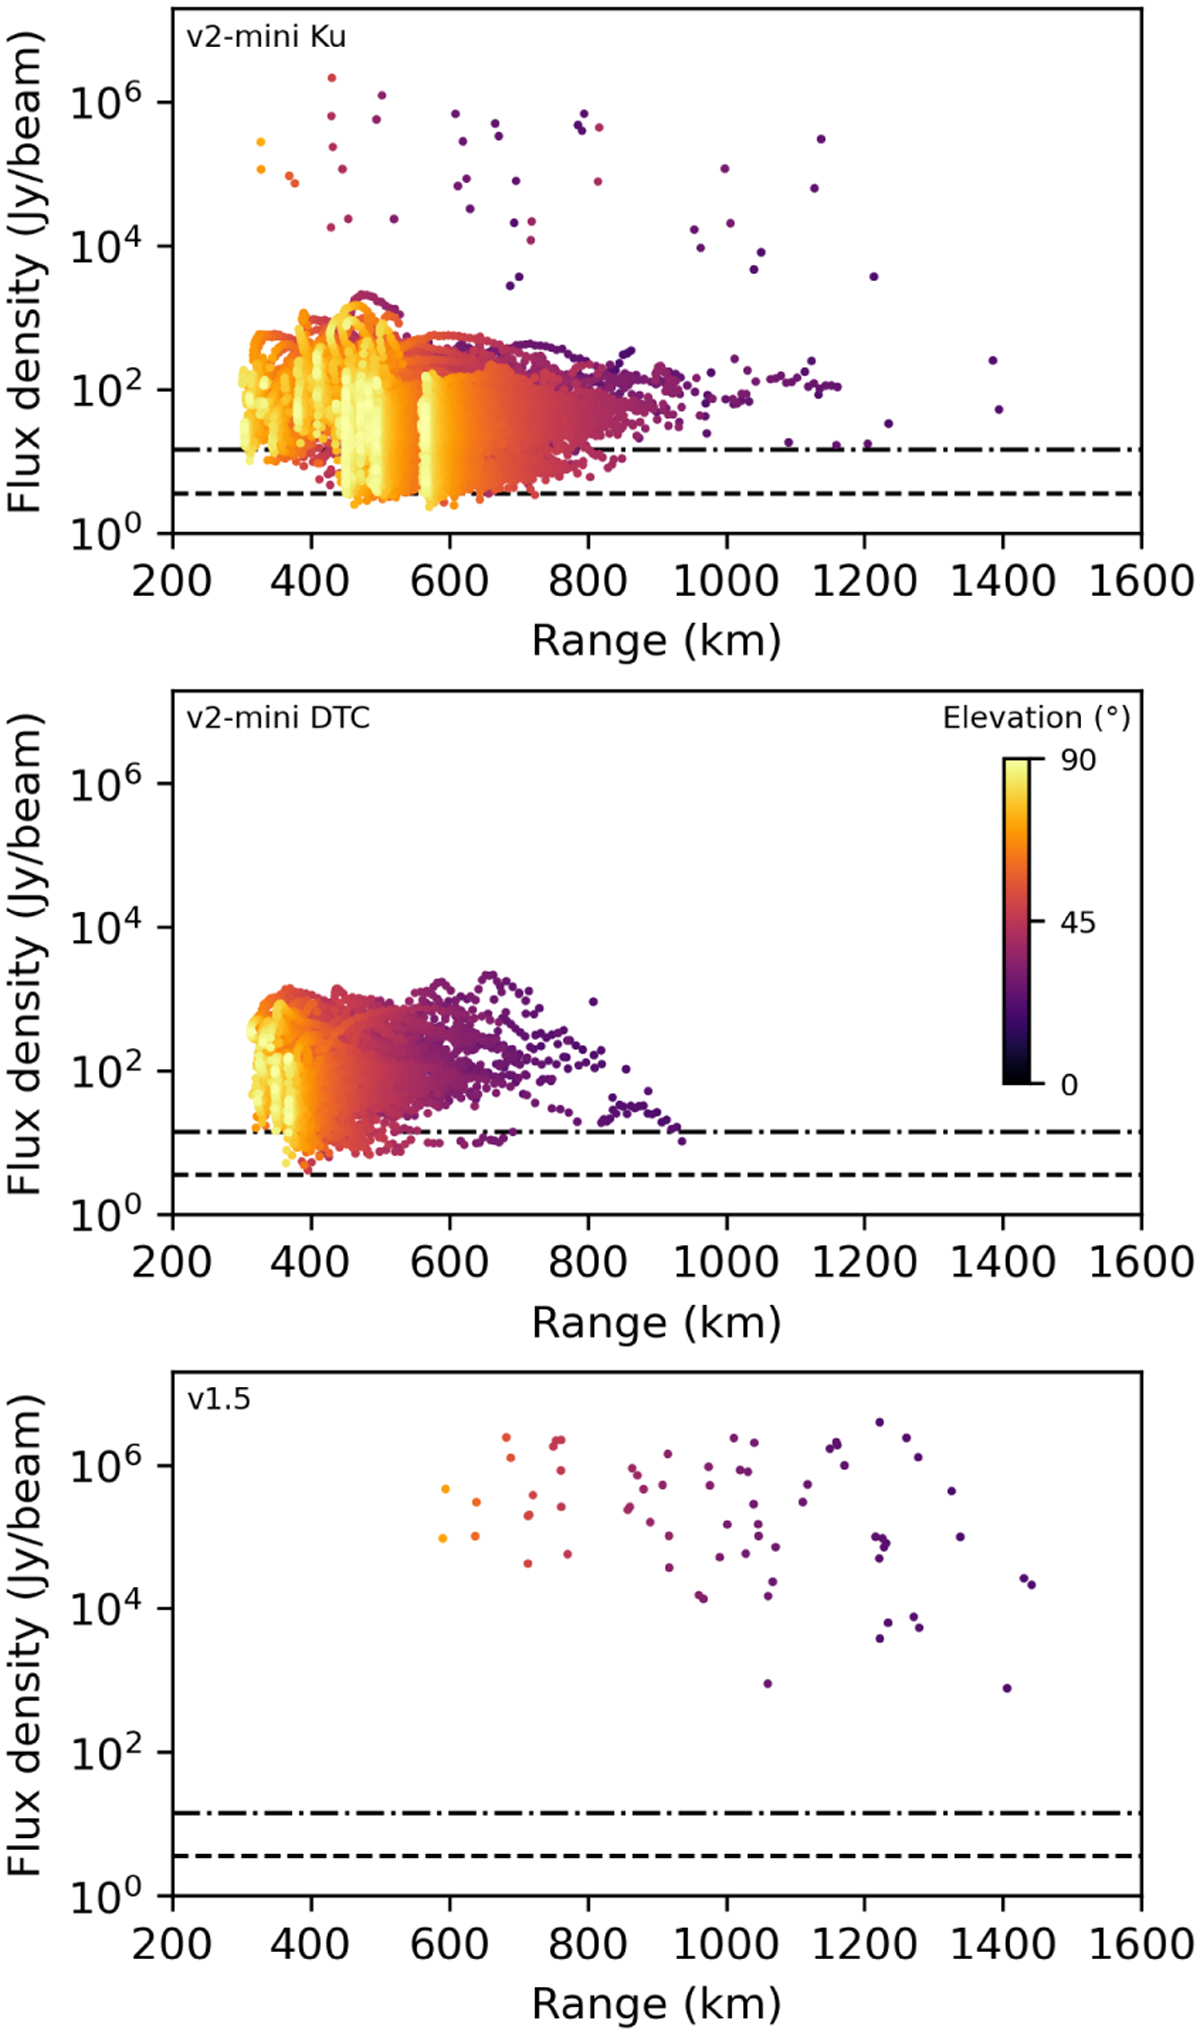
Flux density as a function of range for the three models of detected Starlink satellites for all 54 109 XX polarisation identifications. The dotted lines show the median noise of all images in the XX datasets, with the top line being the dataset with the highest noise and the bottom line showing the median of all datasets. Image noise was calculated by performing two passes of pixel excision above 3σ and calculating the standard deviation of pixel values across a central box in the image whose size is 10% that of the image. This is similar to the procedure used in Hancock et al. (2018).
Current usage metrics show cumulative count of Article Views (full-text article views including HTML views, PDF and ePub downloads, according to the available data) and Abstracts Views on Vision4Press platform.
Data correspond to usage on the plateform after 2015. The current usage metrics is available 48-96 hours after online publication and is updated daily on week days.
Initial download of the metrics may take a while.


