Fig. 1
Download original image
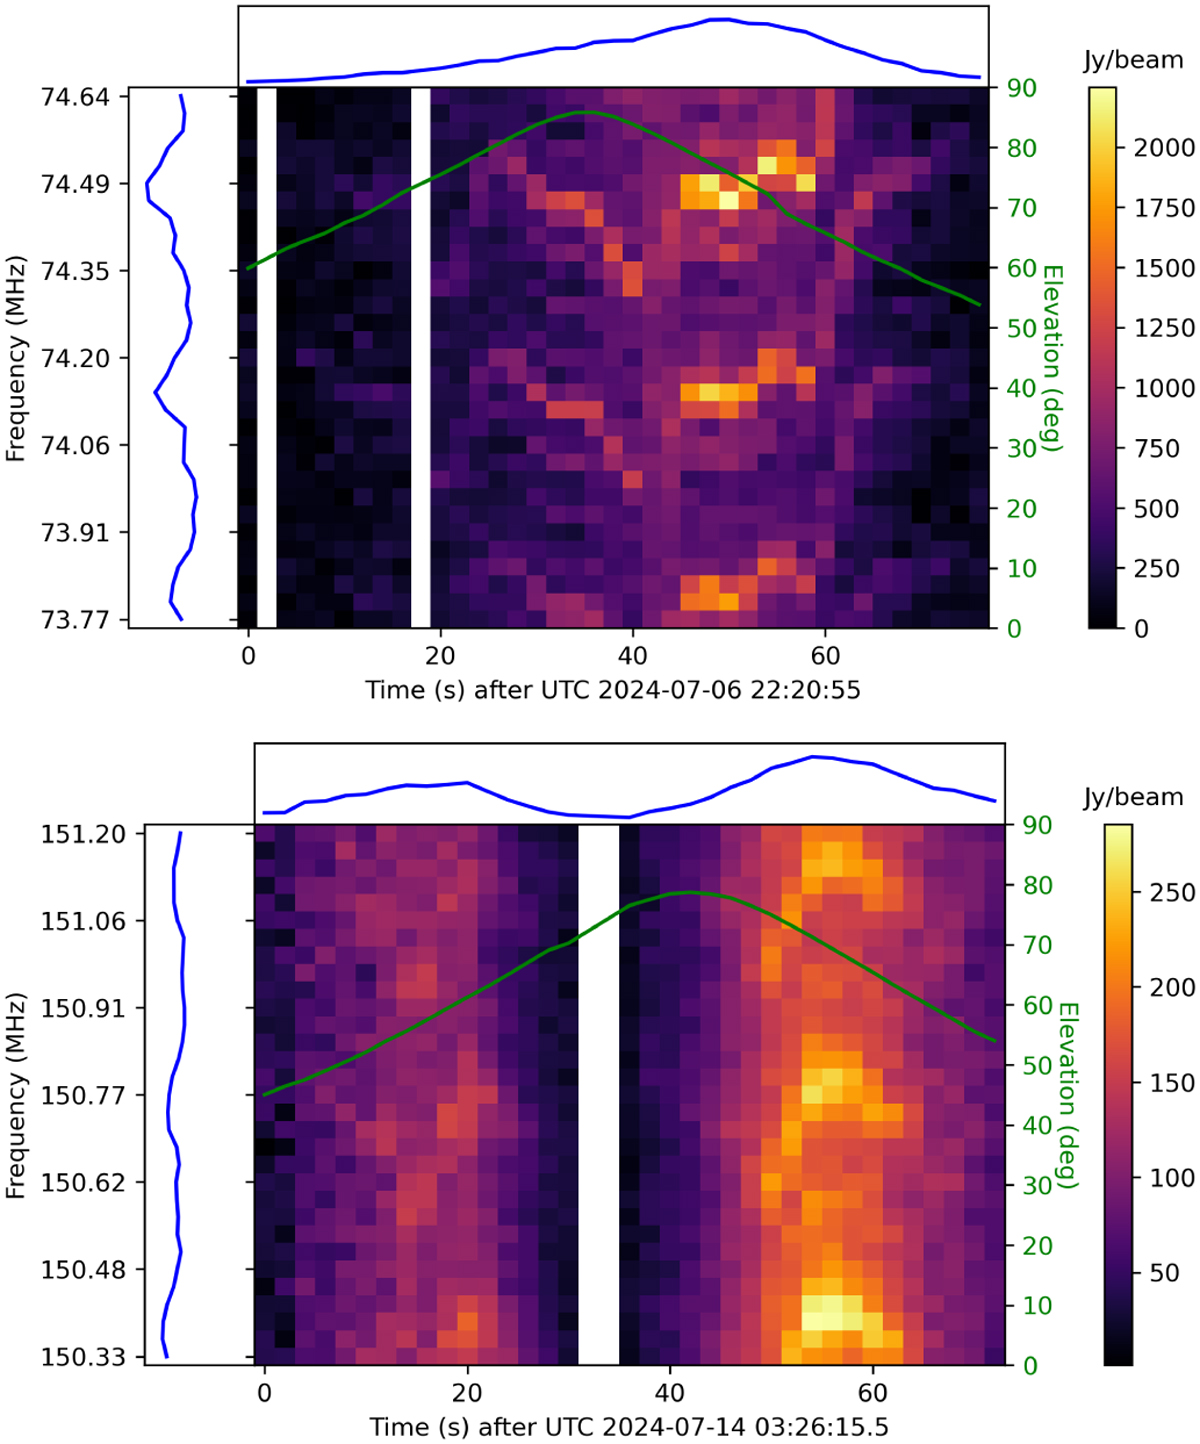
Waterfall plots of two Starlink satellite passes: STARLINK-31967 (NORAD 60021, v2-mini Ku; top) and STARLINK-11173 (NORAD 60192, v2-mini DTC; bottom) within two ITU protected frequencies. The amplitudes in the fine frequency channels are the pixel amplitudes at the fitted location of the satellite. The blue lines show the integrated flux density over a single time step, and the green line shows the elevation of the satellite with respect to EDA2 (90◦ being at the zenith). Timesteps with no values indicate that no fit could be made at the satellite’s predicted location.
Current usage metrics show cumulative count of Article Views (full-text article views including HTML views, PDF and ePub downloads, according to the available data) and Abstracts Views on Vision4Press platform.
Data correspond to usage on the plateform after 2015. The current usage metrics is available 48-96 hours after online publication and is updated daily on week days.
Initial download of the metrics may take a while.