Fig. 3.
Download original image
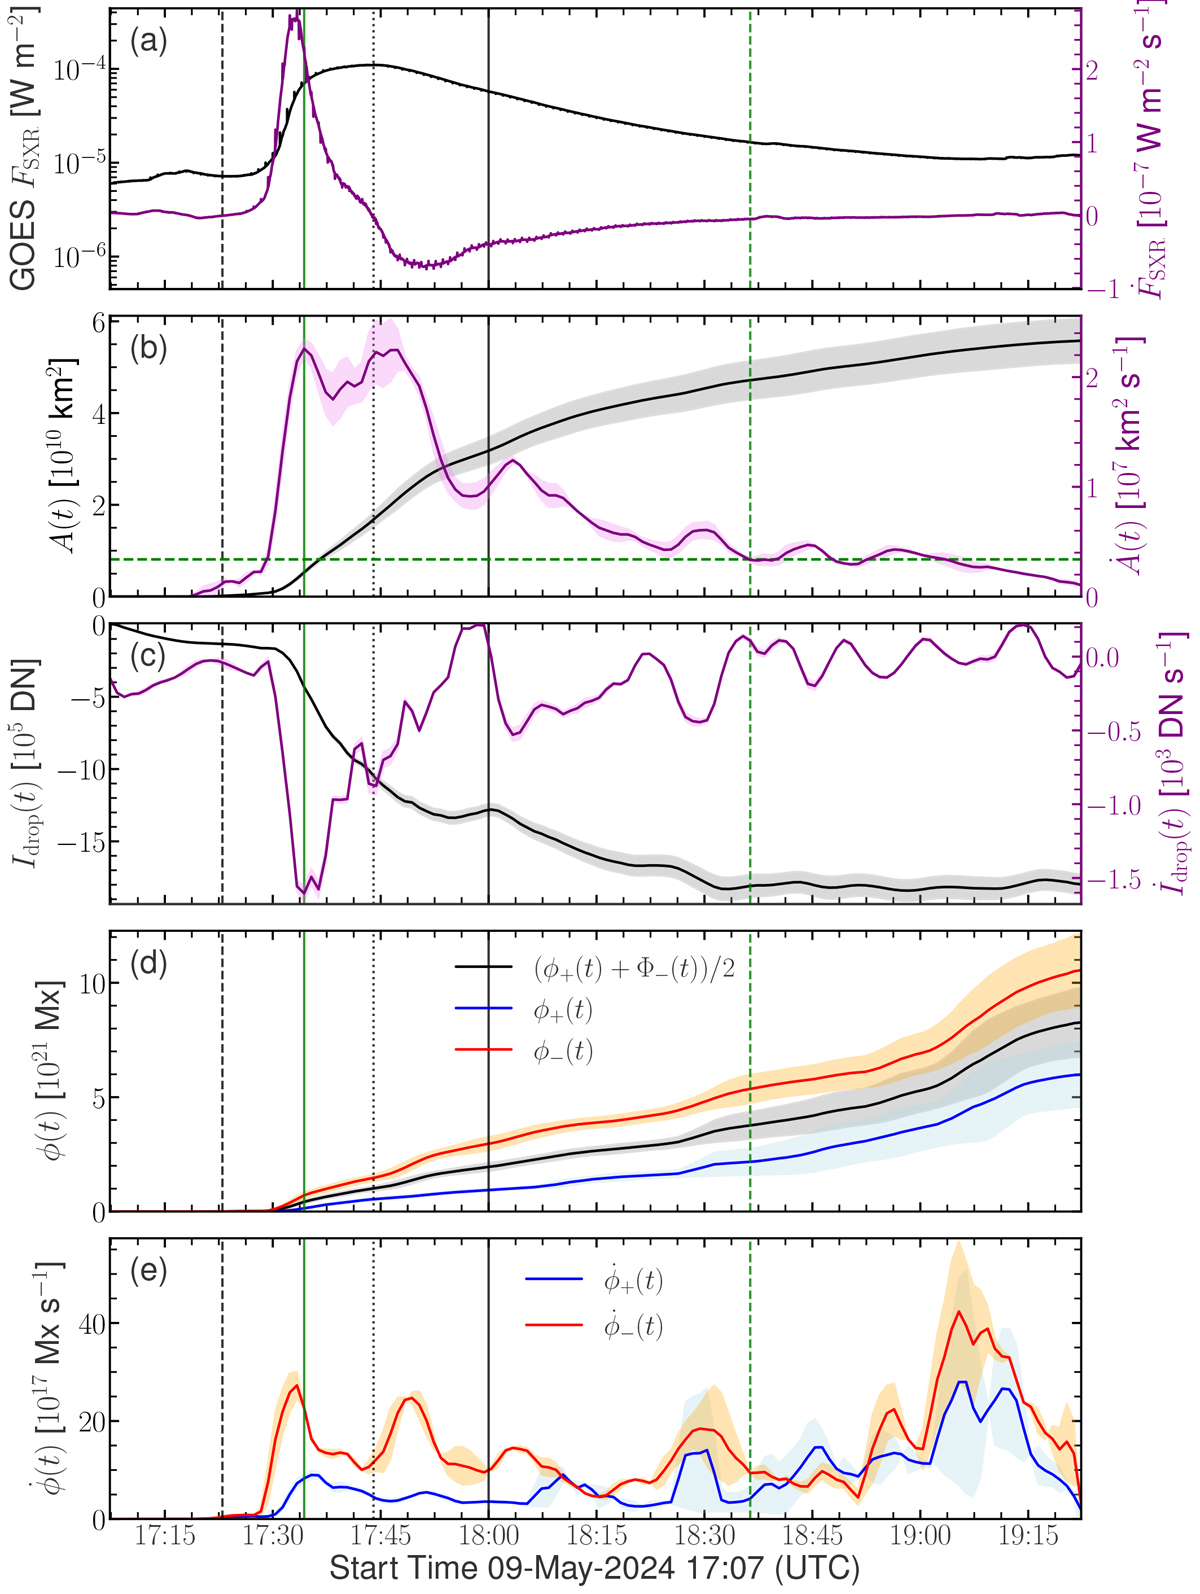
Time evolution of selected dimming parameters for the X1.1 flare on 2024 May 9 (no. 29). From top to bottom: (a) GOES 1.0 − 8.0 Å SXR flux (black) and its time derivative (purple); (b) expansion of the dimming area A(t) (black) and the area growth rate, ![]() (purple), with the horizontal green dashed line marking when
(purple), with the horizontal green dashed line marking when ![]() falls below 15% of its maximum value which defines the end of the impulsive phase of the dimming; (c) brightness drop Idrop(t) (black) and its change rate,
falls below 15% of its maximum value which defines the end of the impulsive phase of the dimming; (c) brightness drop Idrop(t) (black) and its change rate, ![]() (purple) in base-difference units; (d) positive (blue), negative (red) and total unsigned magnetic flux (black) covered by the dimming regions; (e) corresponding magnetic flux rates,
(purple) in base-difference units; (d) positive (blue), negative (red) and total unsigned magnetic flux (black) covered by the dimming regions; (e) corresponding magnetic flux rates, ![]() (blue),
(blue), ![]() (red), and
(red), and ![]() (black). Vertical dashed, dotted, and solid black lines indicate the start, peak, and end of the flare, respectively. The vertical solid and dashed green lines indicate the peak of
(black). Vertical dashed, dotted, and solid black lines indicate the start, peak, and end of the flare, respectively. The vertical solid and dashed green lines indicate the peak of ![]() and the end of the impulsive phase of the dimming, respectively.
and the end of the impulsive phase of the dimming, respectively.
Current usage metrics show cumulative count of Article Views (full-text article views including HTML views, PDF and ePub downloads, according to the available data) and Abstracts Views on Vision4Press platform.
Data correspond to usage on the plateform after 2015. The current usage metrics is available 48-96 hours after online publication and is updated daily on week days.
Initial download of the metrics may take a while.