Fig. 2.
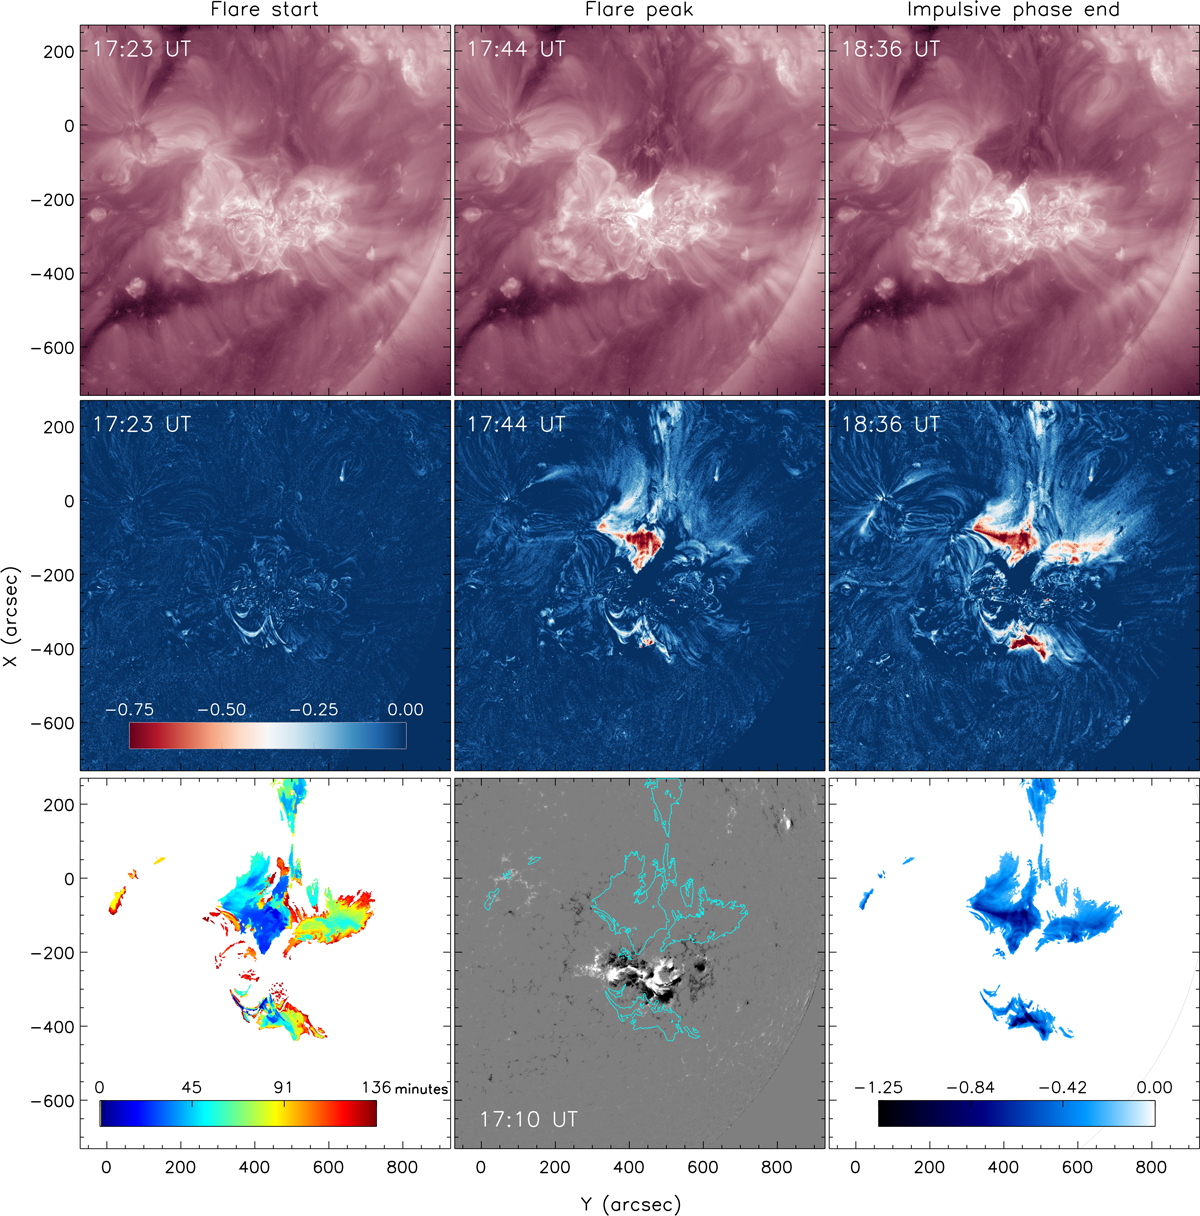
Download original image
Overview of the evolution of the X1.1 flare and associated dimming on 2024 May 9 (no. 29). Top row: SDO/AIA 211 Å direct images of AR 13664 at the flare’s onset, peak time, and the end of the impulsive dimming phase. Second row: Corresponding logarithmic base-ratio images sharing the same colour scale, indicated by the bar in the left panel. Third row: Timing map indicating the first detection time of a dimming pixel (left), the HMI LOS magnetogram with the dimming region outlined in cyan contours (middle), and the minimum intensity map from logarithmic base-ratio data (right).
Current usage metrics show cumulative count of Article Views (full-text article views including HTML views, PDF and ePub downloads, according to the available data) and Abstracts Views on Vision4Press platform.
Data correspond to usage on the plateform after 2015. The current usage metrics is available 48-96 hours after online publication and is updated daily on week days.
Initial download of the metrics may take a while.