Fig. E.2.
Download original image
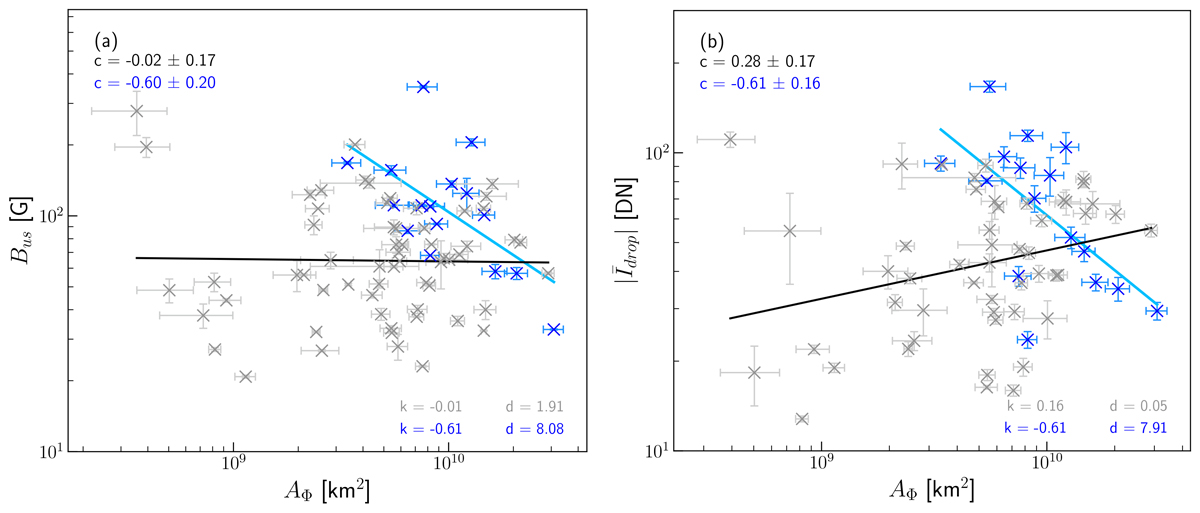
Correlation plots of (a) the magnetic flux density Bus and (b) the mean brightness drop ![]() against the magnetic dimming area Aϕ. Blue crosses represent dimmings from the May 2024 events, while grey crosses correspond to dimming events adapted from Dissauer et al. (2018b). The black (blue) regression line is fitted exclusively to the grey (blue) data points.
against the magnetic dimming area Aϕ. Blue crosses represent dimmings from the May 2024 events, while grey crosses correspond to dimming events adapted from Dissauer et al. (2018b). The black (blue) regression line is fitted exclusively to the grey (blue) data points.
Current usage metrics show cumulative count of Article Views (full-text article views including HTML views, PDF and ePub downloads, according to the available data) and Abstracts Views on Vision4Press platform.
Data correspond to usage on the plateform after 2015. The current usage metrics is available 48-96 hours after online publication and is updated daily on week days.
Initial download of the metrics may take a while.