Fig. E.1.
Download original image
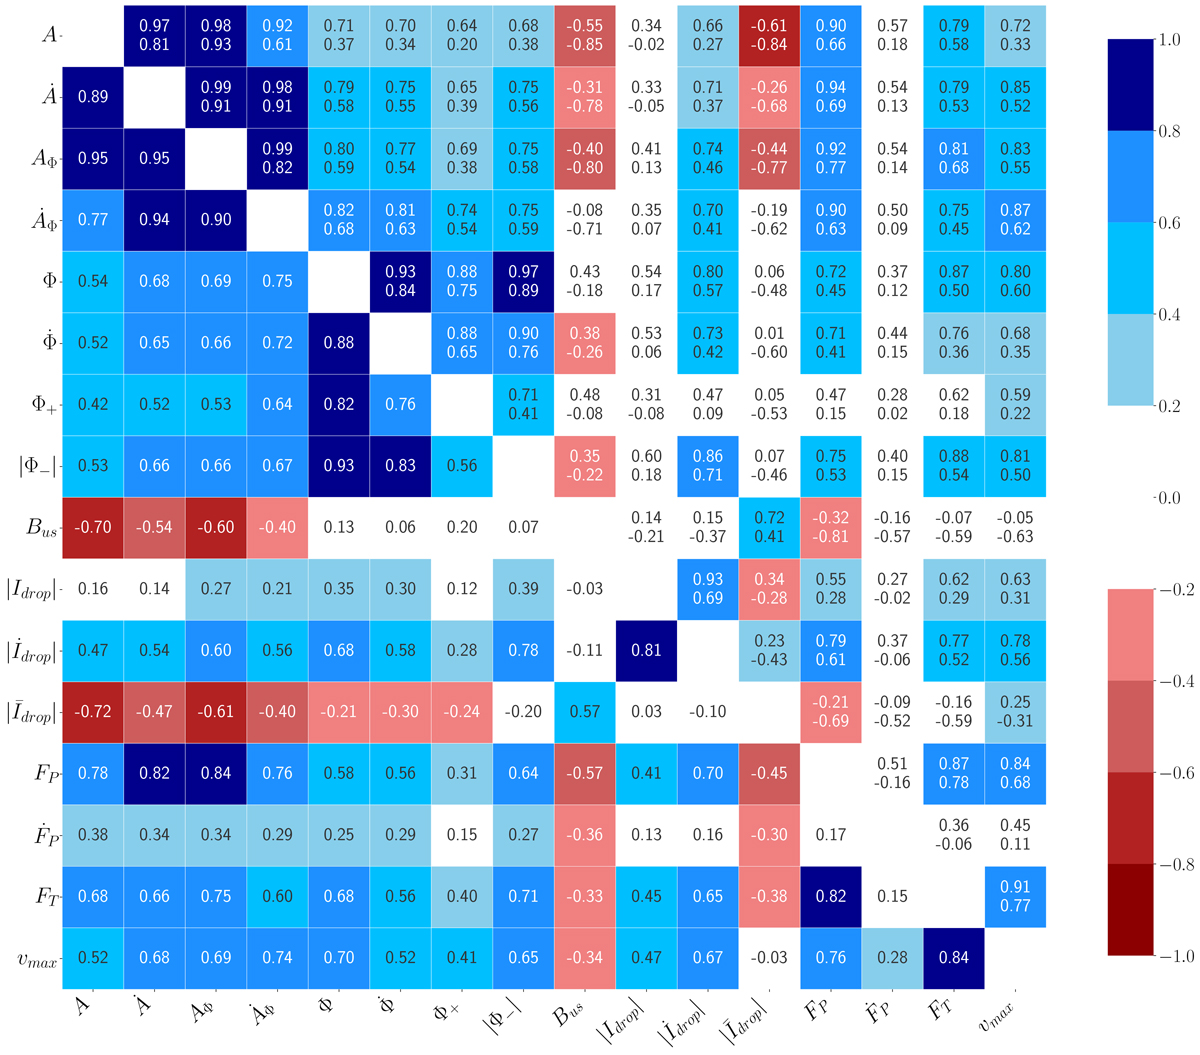
Correlation matrix showing the correlation coefficients ![]() of all possible pairs of dimming parameters, flare parameters and CME maximum velocity vmax. The entries below the main diagonal show the mean correlation coefficient
of all possible pairs of dimming parameters, flare parameters and CME maximum velocity vmax. The entries below the main diagonal show the mean correlation coefficient ![]() , while the entries above the main diagonal show two values:
, while the entries above the main diagonal show two values: ![]() (lower value) and
(lower value) and ![]() (upper value). The colour of the cells indicate the strength of the correlation (blue) or anticorrelation (red). The colours for the cells below the main diagonal are given by
(upper value). The colour of the cells indicate the strength of the correlation (blue) or anticorrelation (red). The colours for the cells below the main diagonal are given by ![]() , while the colours for the cells above the diagonal are given by
, while the colours for the cells above the diagonal are given by ![]() .
.
Current usage metrics show cumulative count of Article Views (full-text article views including HTML views, PDF and ePub downloads, according to the available data) and Abstracts Views on Vision4Press platform.
Data correspond to usage on the plateform after 2015. The current usage metrics is available 48-96 hours after online publication and is updated daily on week days.
Initial download of the metrics may take a while.