Fig. 12.
Download original image
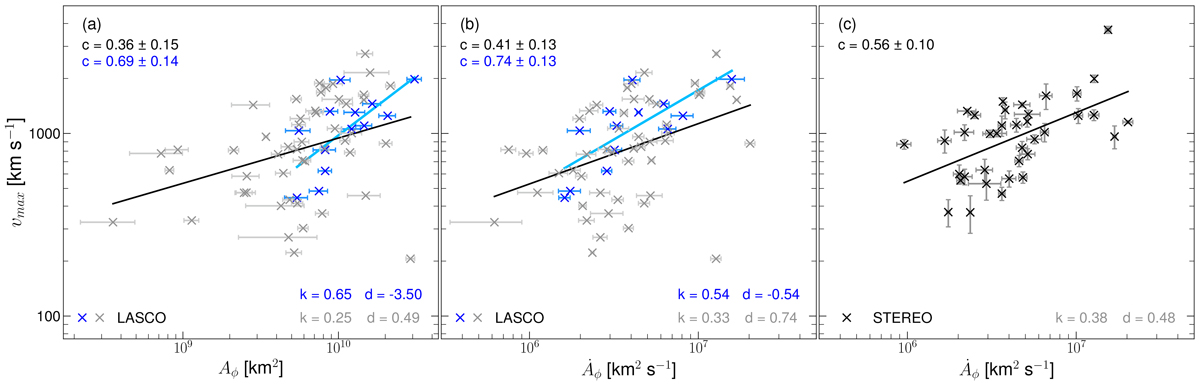
Correlation plots of the CME maximum velocity vmax derived from CDAW SOHO/LASCO C2 and C3 measurements against (a) the magnetic dimming area Aϕ and (b) the magnetic dimming area growth rate ![]() . Blue crosses represent dimmings from the May 2024 events, while grey crosses correspond to dimming events from Dissauer et al. (2019). Panel (c) shows the maximum CME velocities for events adapted from Dissauer et al. (2019) derived from STEREO EUVI+COR1+COR2 measurements. The black (blue) regression lines are fitted exclusively to the grey (blue) data points.
. Blue crosses represent dimmings from the May 2024 events, while grey crosses correspond to dimming events from Dissauer et al. (2019). Panel (c) shows the maximum CME velocities for events adapted from Dissauer et al. (2019) derived from STEREO EUVI+COR1+COR2 measurements. The black (blue) regression lines are fitted exclusively to the grey (blue) data points.
Current usage metrics show cumulative count of Article Views (full-text article views including HTML views, PDF and ePub downloads, according to the available data) and Abstracts Views on Vision4Press platform.
Data correspond to usage on the plateform after 2015. The current usage metrics is available 48-96 hours after online publication and is updated daily on week days.
Initial download of the metrics may take a while.