Fig. 6
Download original image
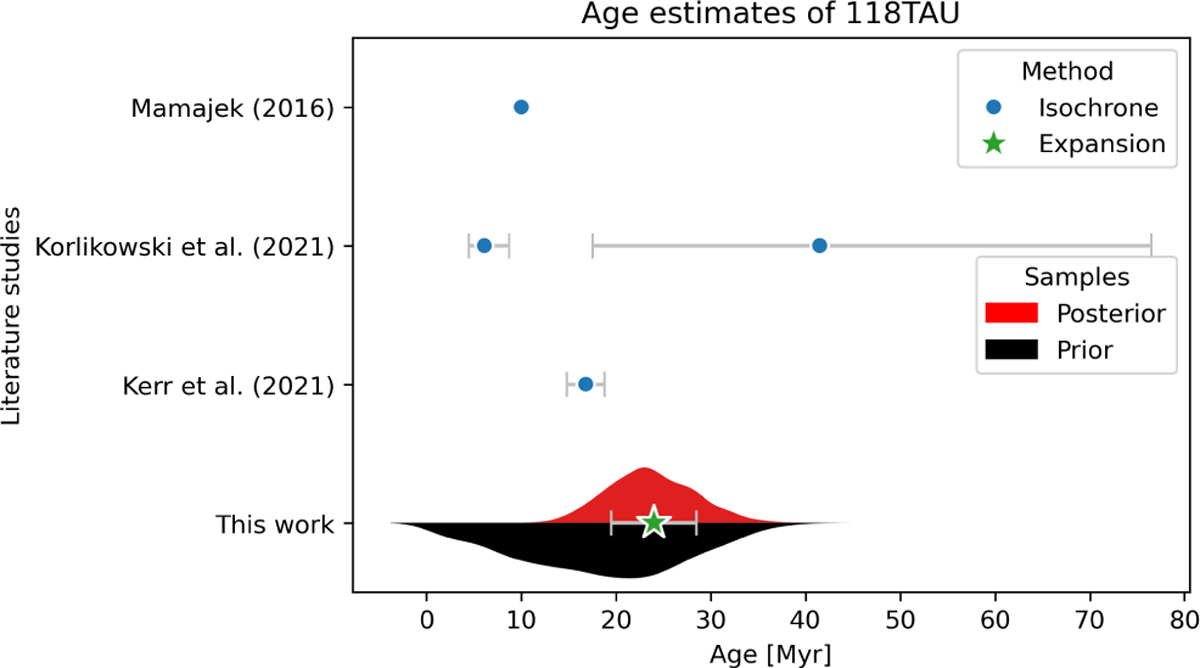
Age distribution for 118TAU. The violin plot shows kernel density estimates obtained from samples of the prior (bottom) and posterior (top) distributions. Previous literature age estimates are included for comparison. The two age estimates by Krolikowski et al. (2021) correspond to those of their young 118TauE and old 118TauW populations.
Current usage metrics show cumulative count of Article Views (full-text article views including HTML views, PDF and ePub downloads, according to the available data) and Abstracts Views on Vision4Press platform.
Data correspond to usage on the plateform after 2015. The current usage metrics is available 48-96 hours after online publication and is updated daily on week days.
Initial download of the metrics may take a while.