Fig. 6
Download original image
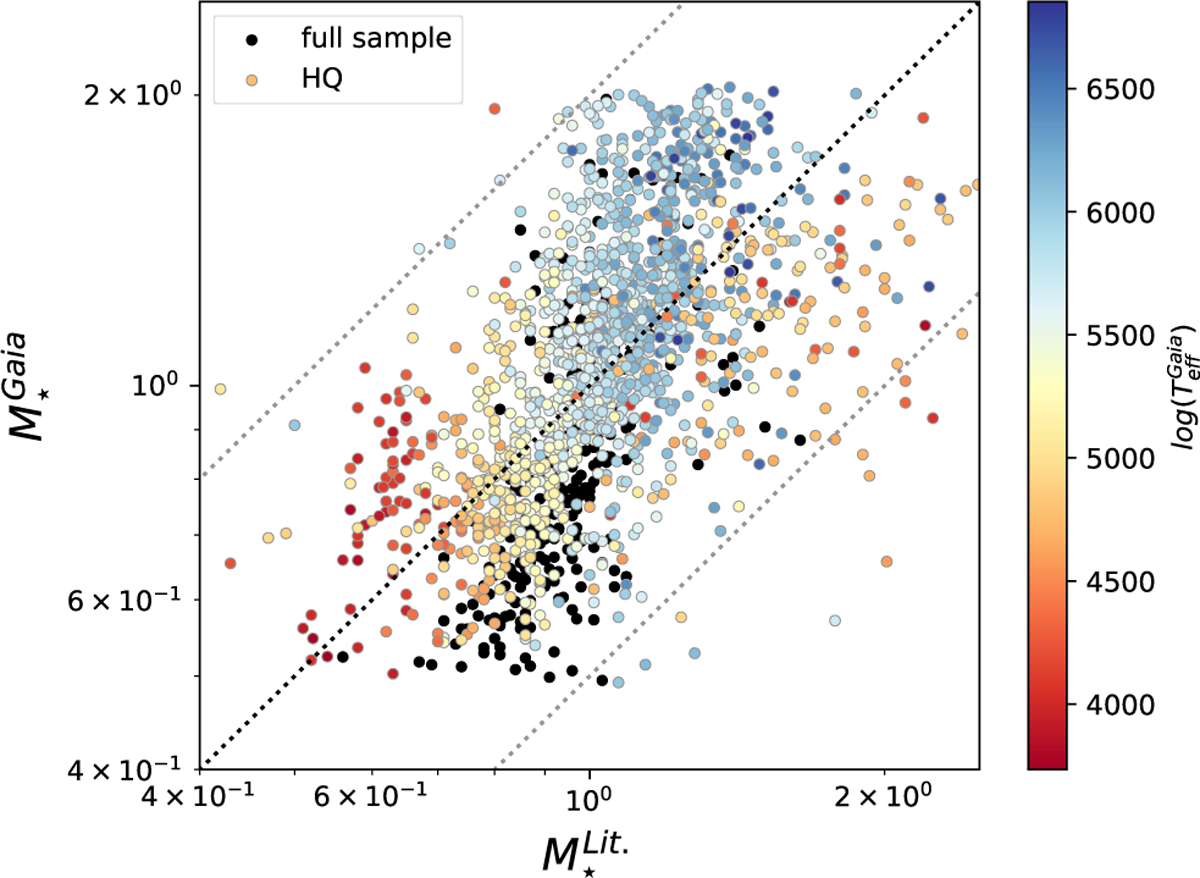
Stellar mass estimated from our Gaia catalogue (y-axis) versus the one given in the exoplanet online tables (x-axis). The black dots correspond to the full sample, while the HQ sample is colour-coded by ![]() . The grey dotted lines show ratios of 2 and 1/2 as visual reference. We refer to Fig. 2 to see the distribution of the
. The grey dotted lines show ratios of 2 and 1/2 as visual reference. We refer to Fig. 2 to see the distribution of the ![]() ratio.
ratio.
Current usage metrics show cumulative count of Article Views (full-text article views including HTML views, PDF and ePub downloads, according to the available data) and Abstracts Views on Vision4Press platform.
Data correspond to usage on the plateform after 2015. The current usage metrics is available 48-96 hours after online publication and is updated daily on week days.
Initial download of the metrics may take a while.