Open Access
Fig. 5
Download original image
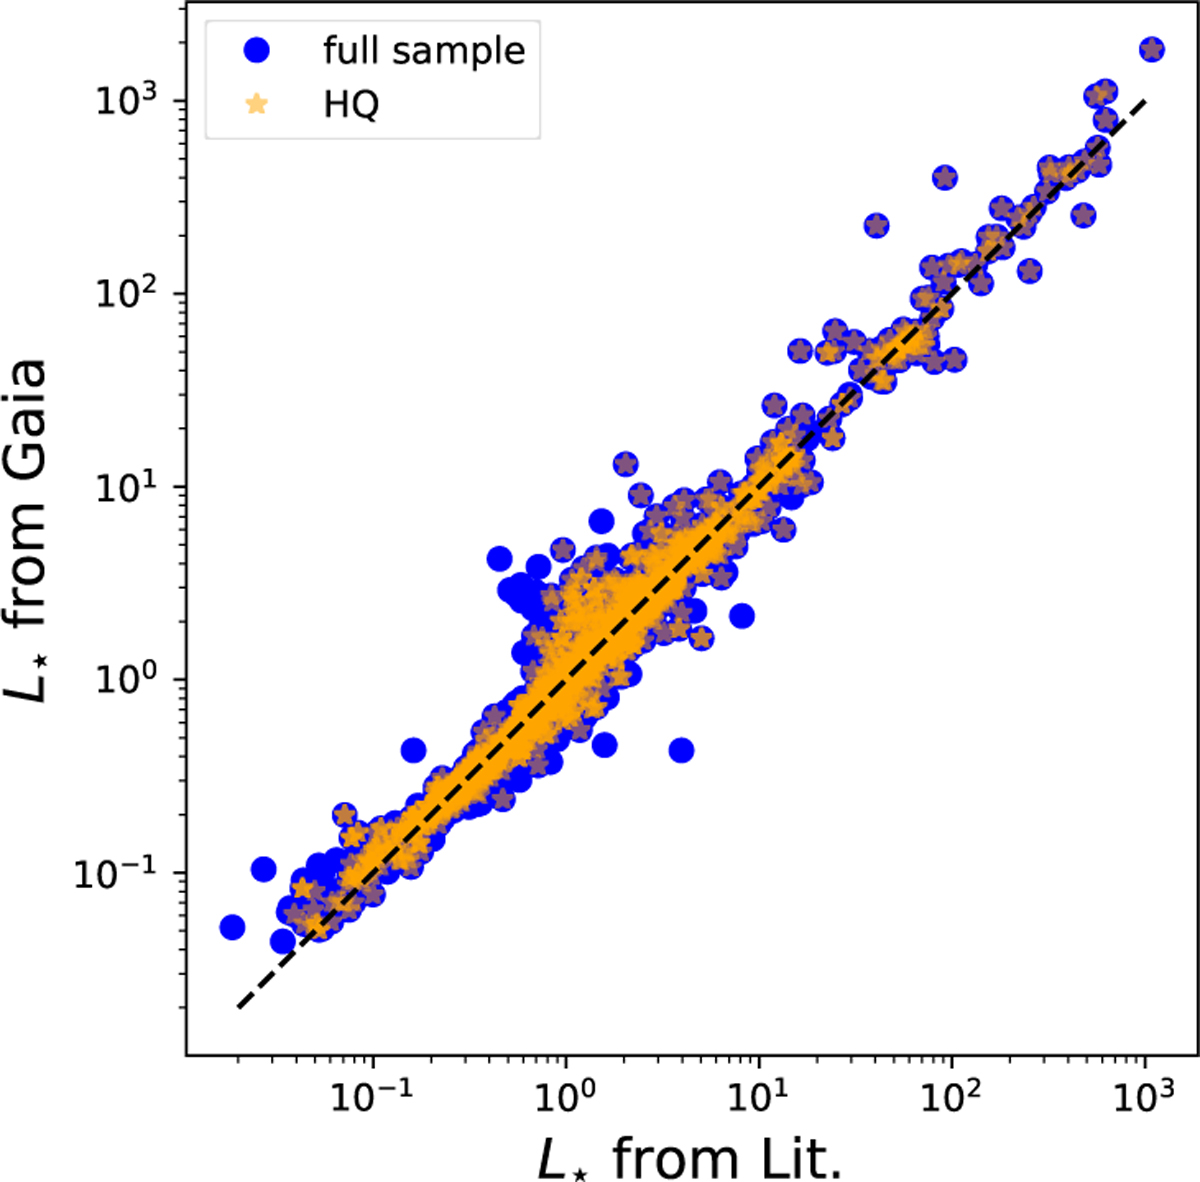
Stellar luminosity comparison between our Gaia spectroscopic catalogue and the data available in the online exoplanet tables. Blue dots correspond to the whole sample while orange dots are the stars with high quality data.
Current usage metrics show cumulative count of Article Views (full-text article views including HTML views, PDF and ePub downloads, according to the available data) and Abstracts Views on Vision4Press platform.
Data correspond to usage on the plateform after 2015. The current usage metrics is available 48-96 hours after online publication and is updated daily on week days.
Initial download of the metrics may take a while.