Fig. A.1
Download original image
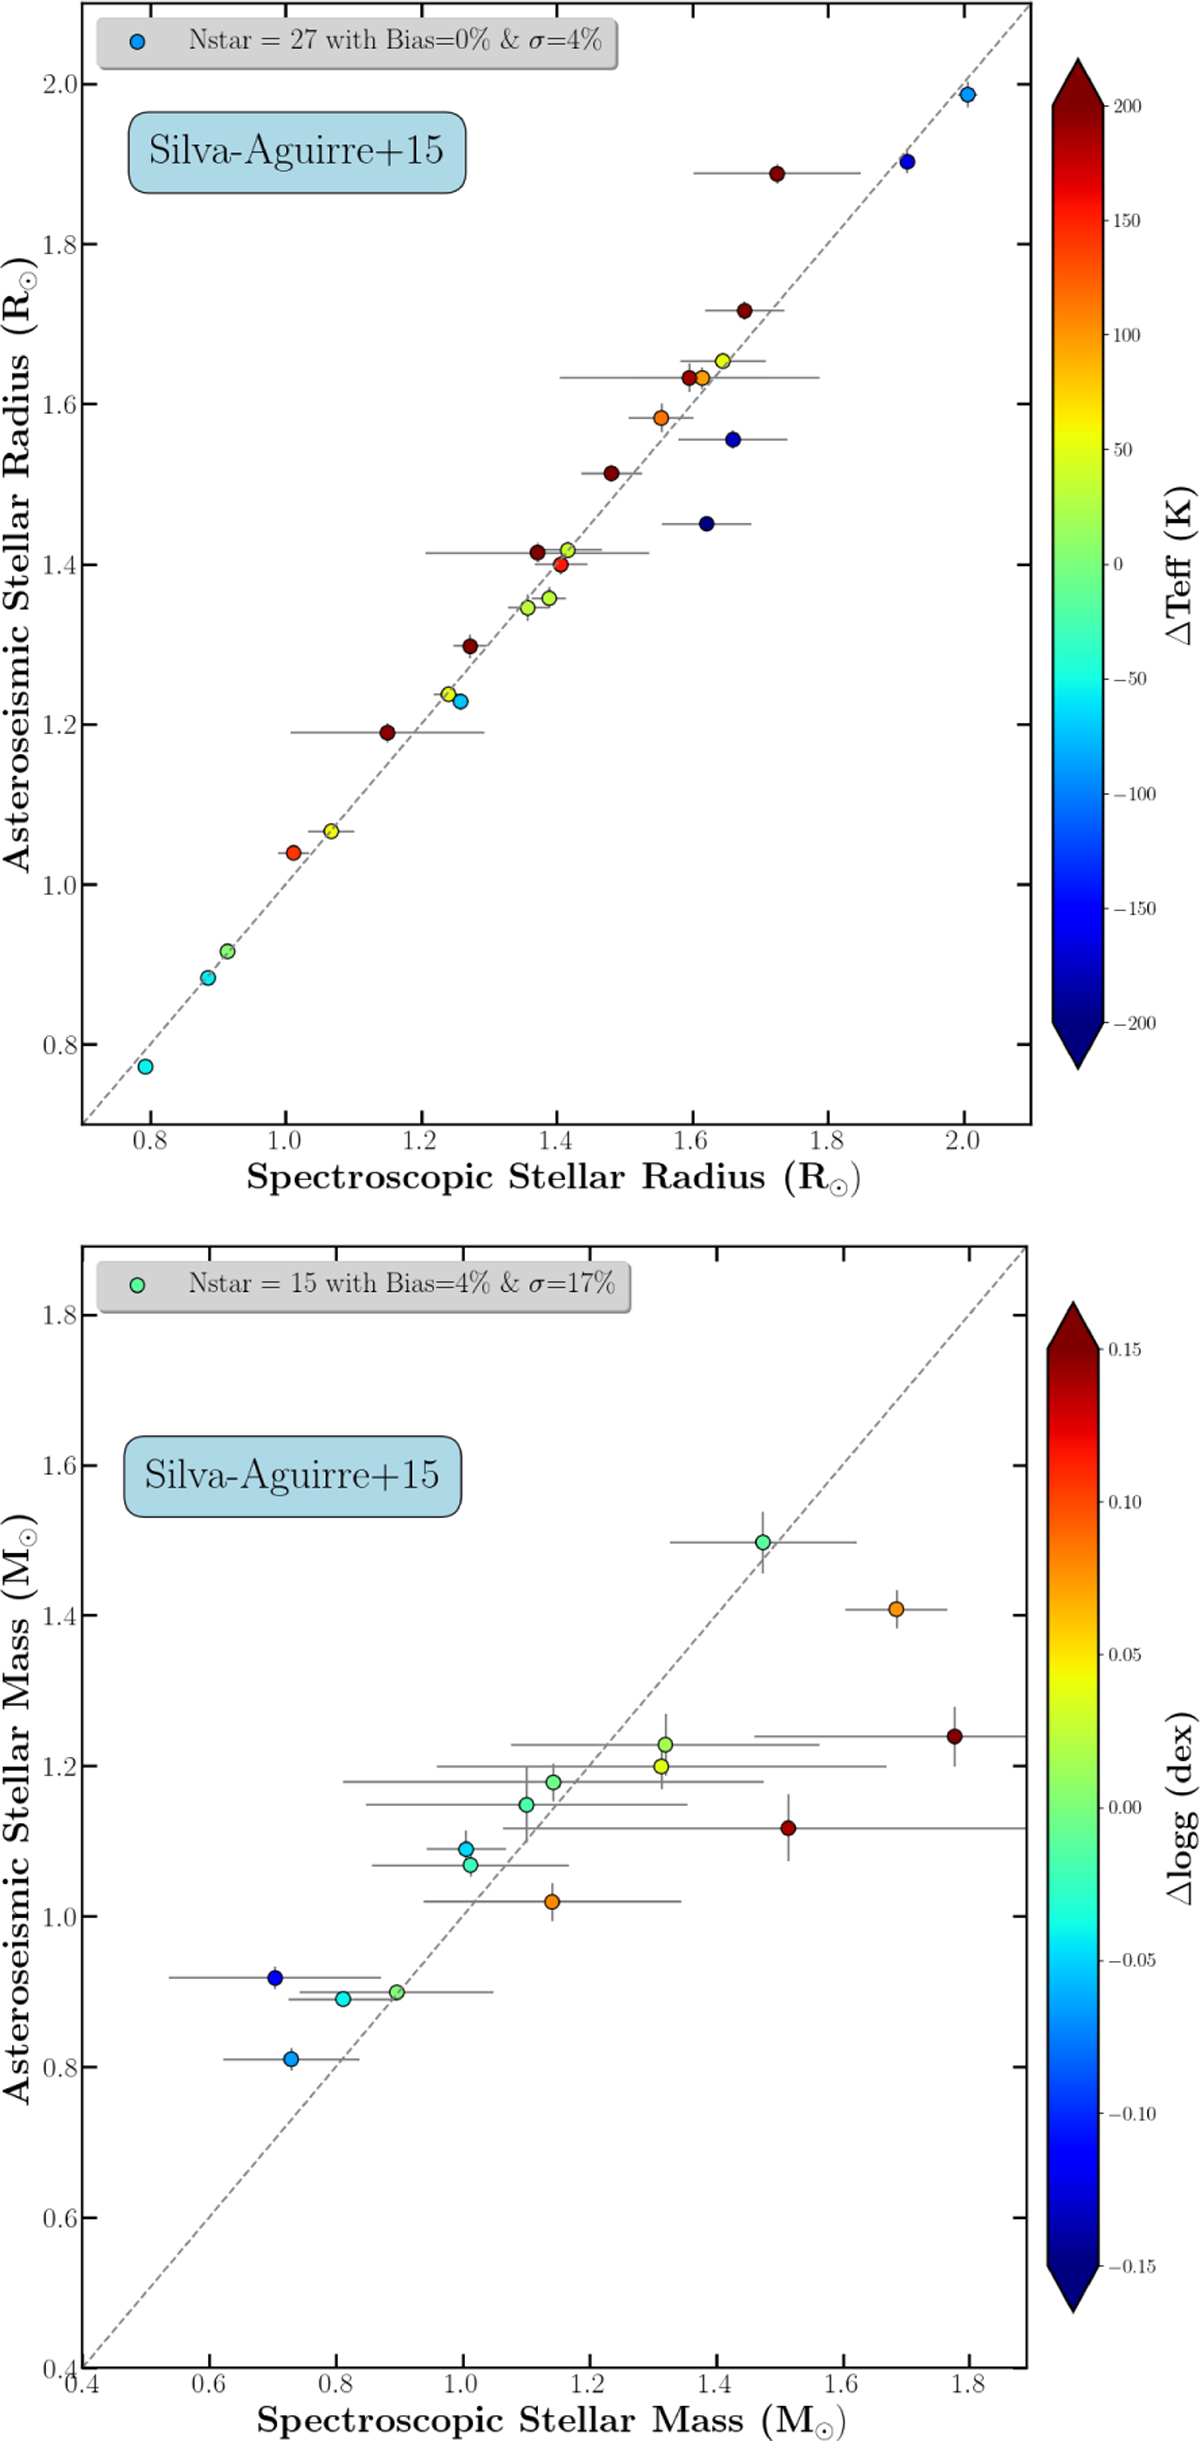
Comparison between the GSP-Spec spectroscopic stellar radii and masses (left and right panels, respectively) and those derived thanks to asteroseismic data by Silva Aguirre et al. (2015). The 1:1 relation is shown as a dashed grey line. The colour-codes represent the difference in Teff and log(g) between both studies. The mean ![]() and
and ![]() relative differences and associated standard deviations indicated in each panel are in the sense of (Astero - GSP-Spec)/Astero.
relative differences and associated standard deviations indicated in each panel are in the sense of (Astero - GSP-Spec)/Astero.
Current usage metrics show cumulative count of Article Views (full-text article views including HTML views, PDF and ePub downloads, according to the available data) and Abstracts Views on Vision4Press platform.
Data correspond to usage on the plateform after 2015. The current usage metrics is available 48-96 hours after online publication and is updated daily on week days.
Initial download of the metrics may take a while.