Fig. 6.
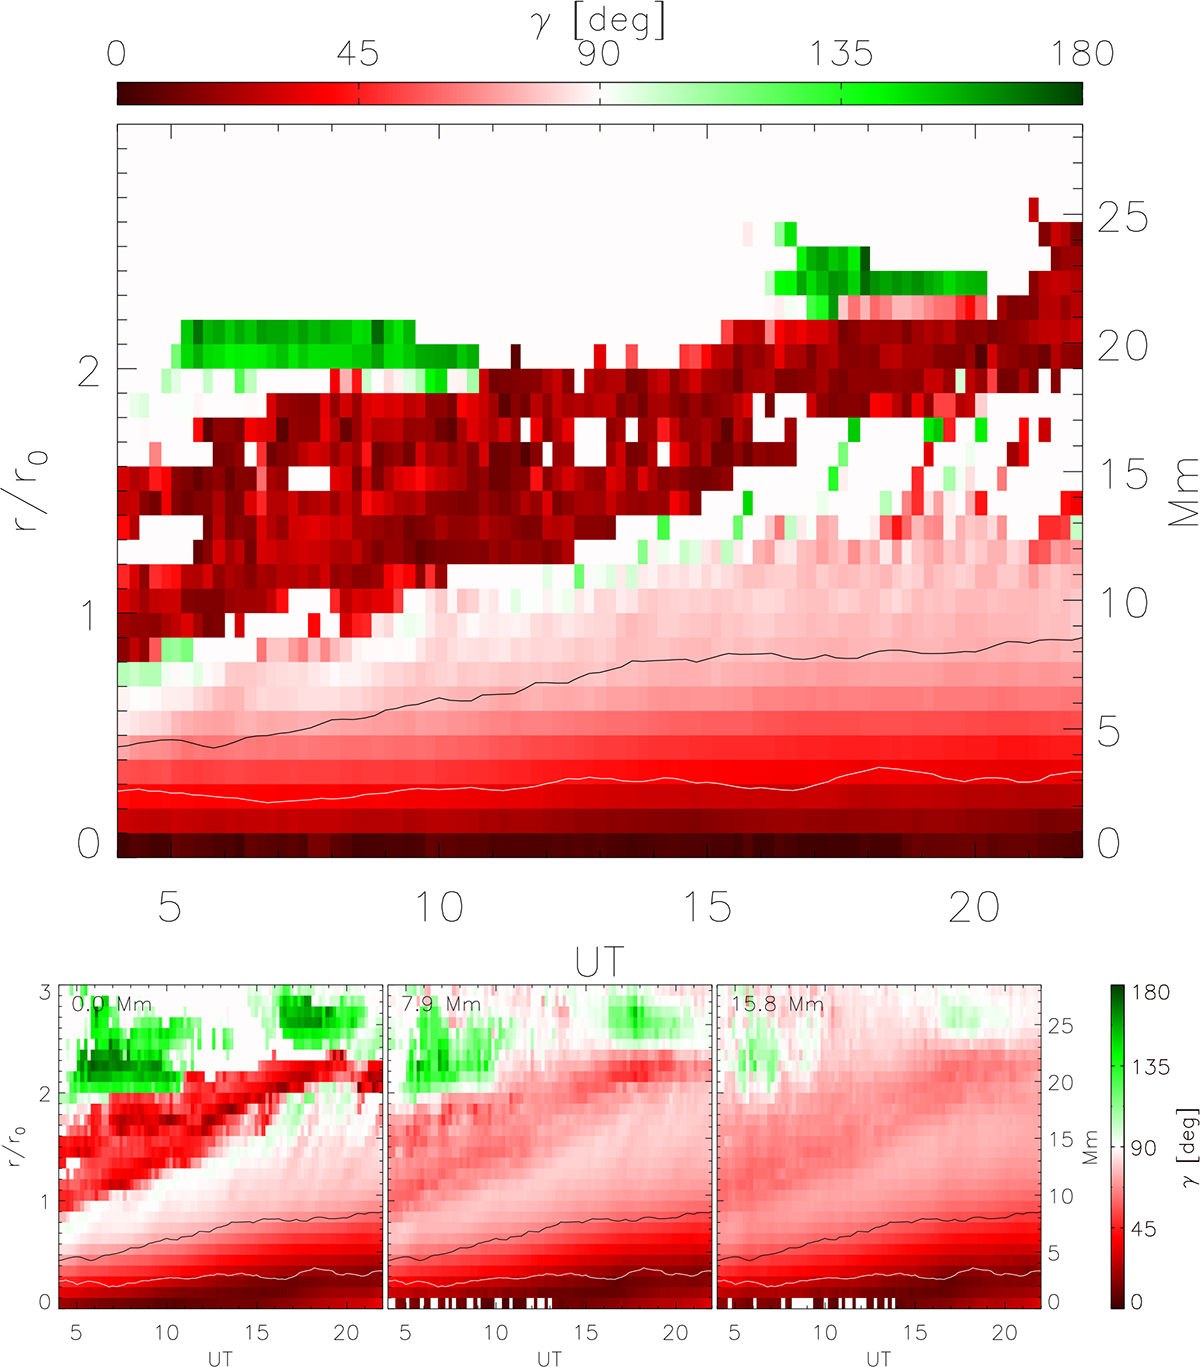
Download original image
Upper panel: Time-distance plot of the azimuthally averaged values of magnetic field inclination derived from HMI observations in the ROI marked by the dashed red lines in Fig. 1 at the photospheric level. The white and black lines outline the mean position of the umbra/penumbra and penumbra/quiet Sun boundaries, respectively. Lower panels: Same as upper panel but for the extrapolations at 0 Mm, 7.9 Mm, and 15.8 Mm. The azimuthal average of γ is only applied in pixels where B > 200 G.
Current usage metrics show cumulative count of Article Views (full-text article views including HTML views, PDF and ePub downloads, according to the available data) and Abstracts Views on Vision4Press platform.
Data correspond to usage on the plateform after 2015. The current usage metrics is available 48-96 hours after online publication and is updated daily on week days.
Initial download of the metrics may take a while.