Fig. 5.
Download original image
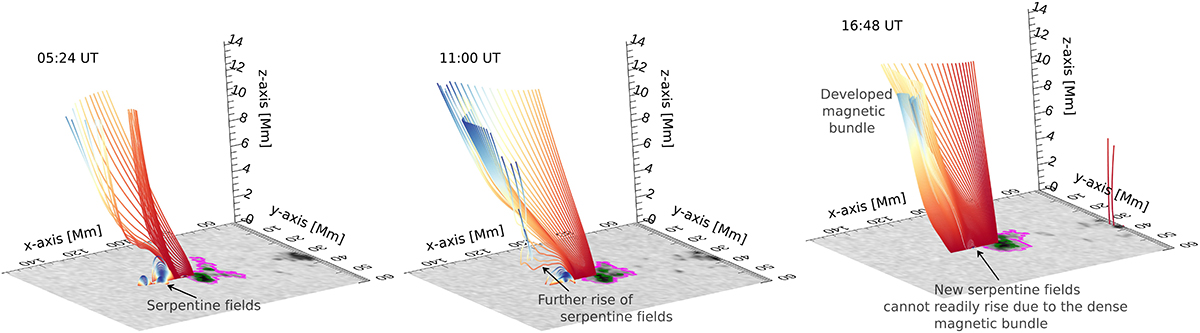
Snapshots of the magnetic field lines in a selected area at different stages during penumbra formation. Each height step corresponds to 2.6 Mm. The colour coding represents the proximity of the field-line summit: blueish tones indicate nearby field lines that close locally, while reddish tones indicate more distant summits (‘open’ field lines connecting to the AR opposite polarity or extending beyond).
Current usage metrics show cumulative count of Article Views (full-text article views including HTML views, PDF and ePub downloads, according to the available data) and Abstracts Views on Vision4Press platform.
Data correspond to usage on the plateform after 2015. The current usage metrics is available 48-96 hours after online publication and is updated daily on week days.
Initial download of the metrics may take a while.