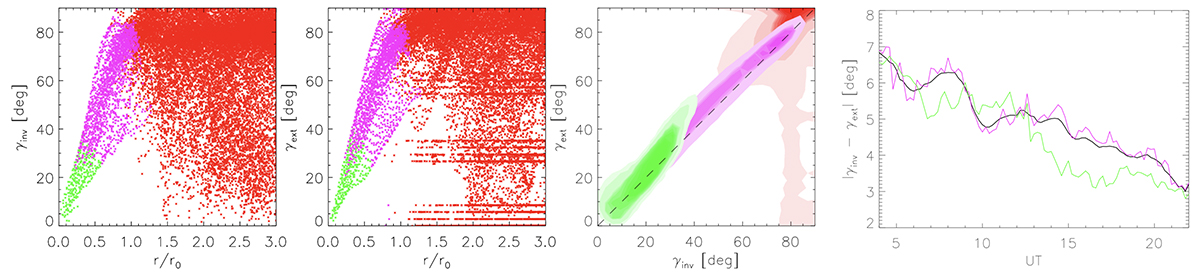
Fig. 2.
Download original image
Comparison of magnetic field inclination from ME inversion (γinv) and from NLFFF extrapolation (γext) within the outermost ellipse marked in Fig. 1. From left to right, the first and second panels show the scatter plots of γinv and γext, respectively, as a function of radial distance from the spot centre for data from 22:00 UT (fully fledge spot). The third panel shows the probability density function of the relation between γext on γinv for all times and all pixels within the ellipse. The green colour corresponds to pixels with I/Ic < 0.5 (umbra), the magenta colour corresponds to pixels with 0.5 < I/Ic < 0.95 (penumbra), and the red colour corresponds to pixels with I/Ic > 0.95. The right-most panel shows the mean difference between the inclination values determined from extrapolations and from inversions in penumbral regions (magenta line) and umbral regions (green line). The black line shows the smoothed value for all pixels within the sunspot.
Current usage metrics show cumulative count of Article Views (full-text article views including HTML views, PDF and ePub downloads, according to the available data) and Abstracts Views on Vision4Press platform.
Data correspond to usage on the plateform after 2015. The current usage metrics is available 48-96 hours after online publication and is updated daily on week days.
Initial download of the metrics may take a while.