Fig. 10.
Download original image
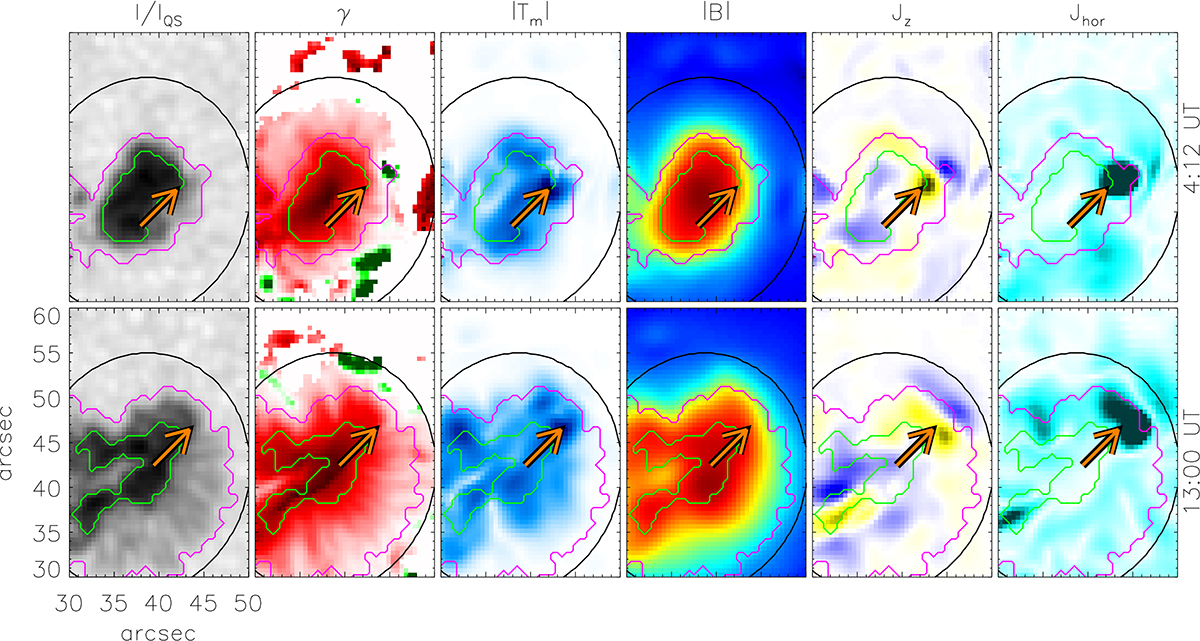
Close-up of the protospot at 4:12 UT (top row) and 13:00 UT (bottom row) as seen in (from left to right) intensity maps, magnetic inclination, magnetic tension, magnetic field strength resulting from extrapolation, vertical and horizontal currents. All colour coding identical to previous images except for inclination, where dark green corresponds to 110 deg. The arrows point to the centre of gravity of the Tm enhancements.
Current usage metrics show cumulative count of Article Views (full-text article views including HTML views, PDF and ePub downloads, according to the available data) and Abstracts Views on Vision4Press platform.
Data correspond to usage on the plateform after 2015. The current usage metrics is available 48-96 hours after online publication and is updated daily on week days.
Initial download of the metrics may take a while.