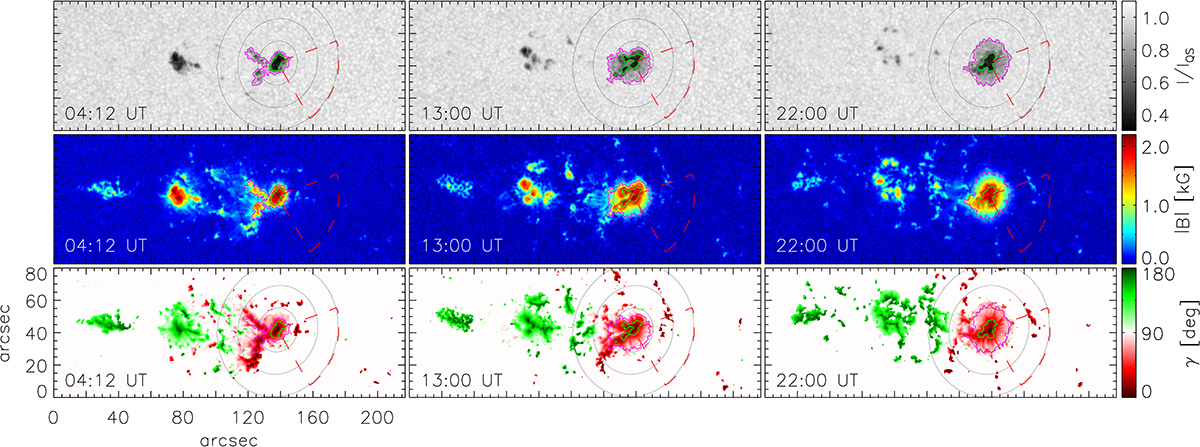
Fig. 1.
Download original image
HMI intensity maps (top row) and magnetic field strength (middle row) and magnetic field inclination (bottom row) of the AR 12757 on January 26, 2020. Magnetic field inclination is shown only in pixels with B > 150 G. Maps corresponding to the start and end times of our analysis are shown in the left and right panels, respectively. The middle panels show the active region in the middle of the analysed time period. The green and magenta contours show the umbra/penumbra and penumbra/quiet Sun boundaries, respectively. The black oval contours show the distance from the ellipse centre at r/r0 = 1, 2, 3, where r0 is the “radius” of the ellipse fitted to the penumbra/quiet Sun boundary at the end time of the analysed time period. The red dashed contours show our region of interest (ROI). The temporal evolution of a close-up of the are under study is available online.
Current usage metrics show cumulative count of Article Views (full-text article views including HTML views, PDF and ePub downloads, according to the available data) and Abstracts Views on Vision4Press platform.
Data correspond to usage on the plateform after 2015. The current usage metrics is available 48-96 hours after online publication and is updated daily on week days.
Initial download of the metrics may take a while.