Fig. 7
Download original image
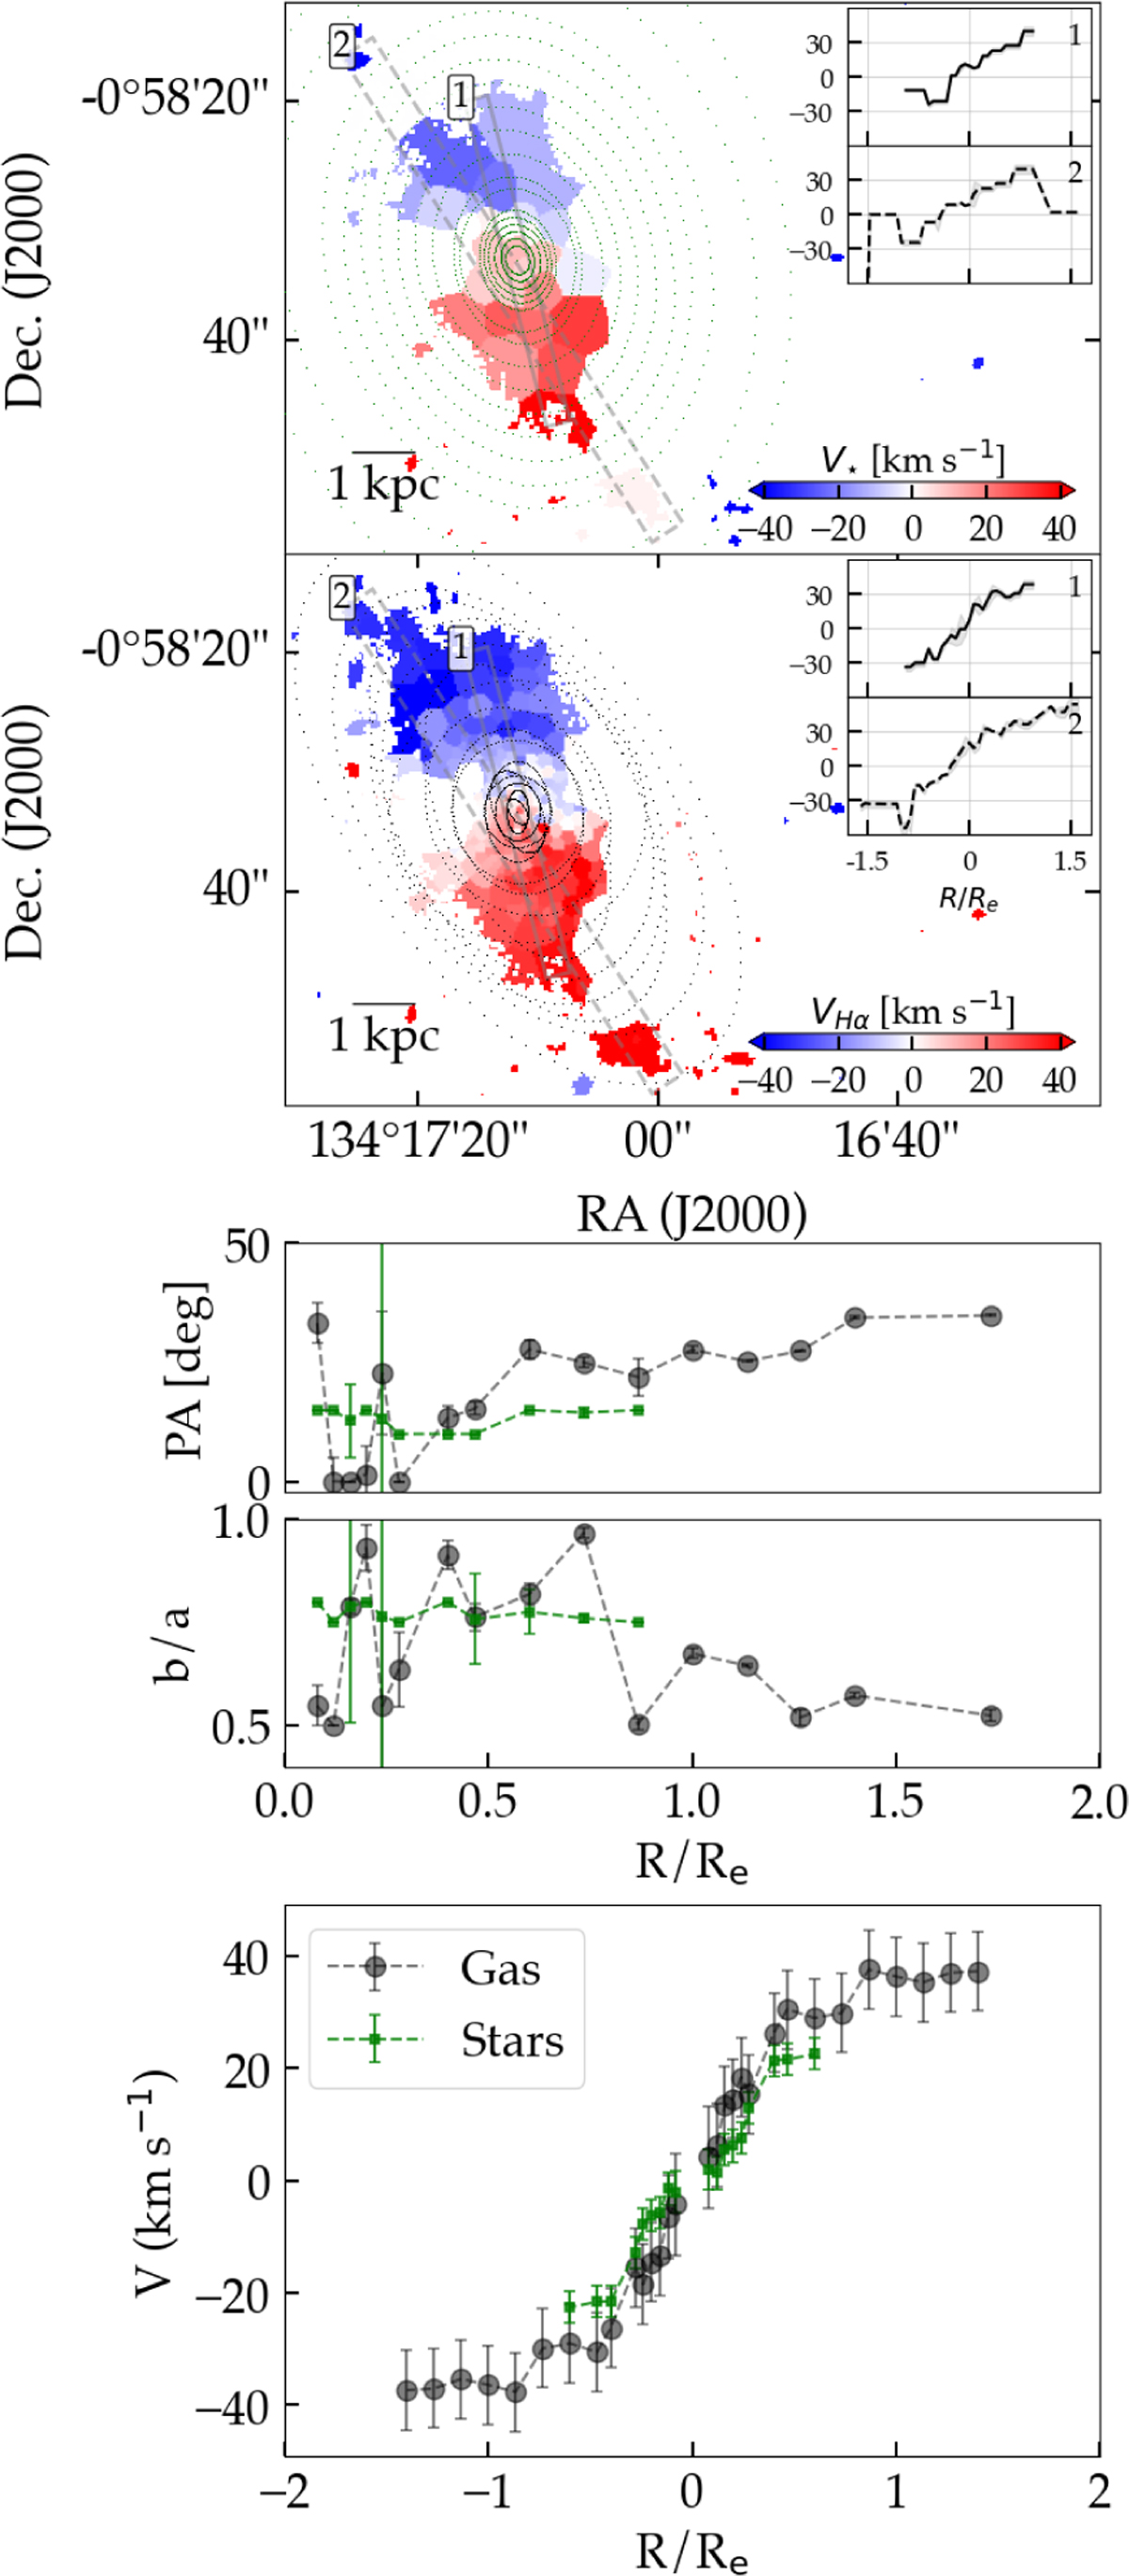
Velocity fields of GAMA 526784. First and second rows: stellar and ionised gas velocity maps, respectively. The dotted ellipses represent the best-fit ellipses from kinemetry, while the rectangles indicate median measurements shown in the inset panels, with the grey bands illustrating the associated uncertainties. Third and fourth panels: variation in the position angle and axis ratio from kinemetry, with the stellar component shown in green and the gas component in black. A transition is observed in the gas from the central to the outer regions, where the central component is rounder, while the outskirts become more elongated and are misaligned by approximately 20∘. Fifth panel: best-fit velocity model from kinemetry. The stellar component exhibits slower rotation, with velocities around 20 km s−1, while the gas reaches velocities of up to 40 km s−1.
Current usage metrics show cumulative count of Article Views (full-text article views including HTML views, PDF and ePub downloads, according to the available data) and Abstracts Views on Vision4Press platform.
Data correspond to usage on the plateform after 2015. The current usage metrics is available 48-96 hours after online publication and is updated daily on week days.
Initial download of the metrics may take a while.