Fig. 3
Download original image
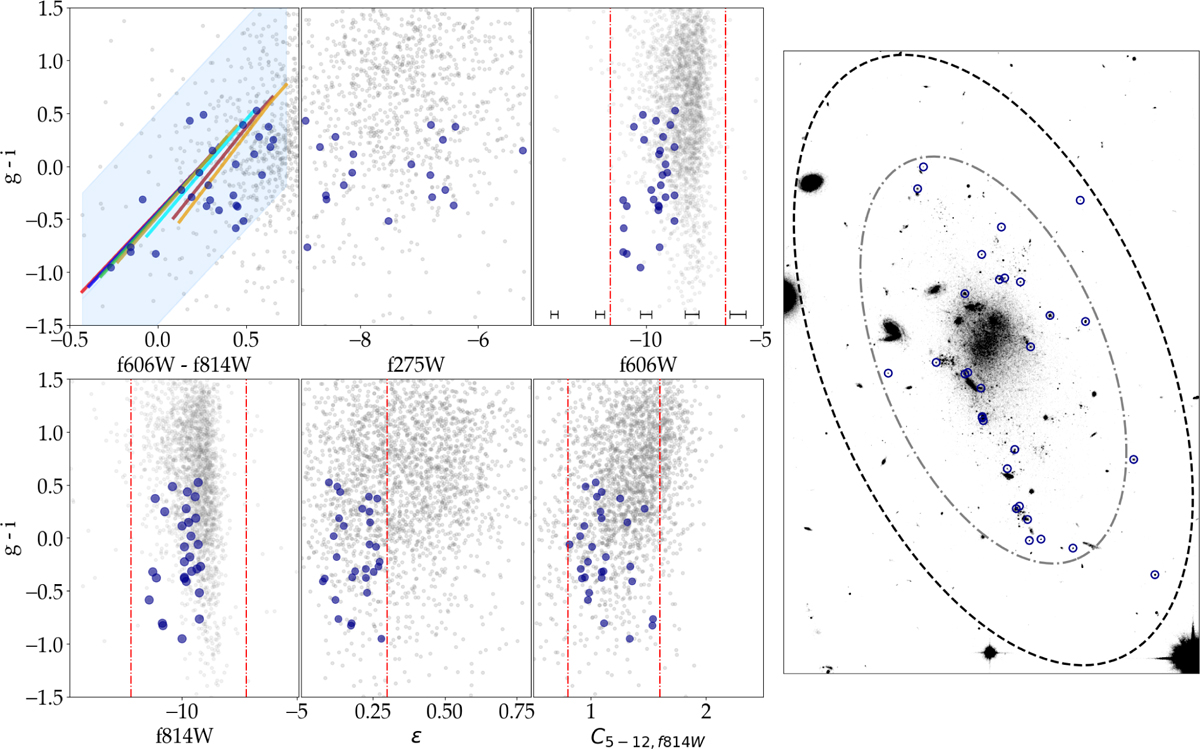
Star cluster selection criteria based on expected colours, magnitudes, ellipticity and concentration. In all panels, grey dots represent the detections from SExtractor. Top left: colours predicted from SSP models are shown as continuous lines, with different colours corresponding to metallicities ranging from −2.0 to 0.2 dex. The extent of the lines reflects the age range (0.1−14 Gyr). We fit a linear relation to these predictions and define an error margin of 0.5 (∼3σ) mag to account for uncertainties in both the models and the observed colours. The blue-shaded region shows this allowed space. Top middle, top right and bottom left: colour-magnitude distribution of detected sources. We applied magnitude cuts in the F606W and F814W bands based on the expected peak of the luminosity function for young star clusters, allowing for sources 3σ brighter and 1σ fainter than the peak. The error bars at the bottom of the F606W panel show the typical uncertainties of sources at the respective magnitudes. Bottom middle: ellipticity cuts to select unresolved or nearly circular sources. Bottom right: concentration parameter defined as the magnitude difference in 5 and 12 aperture radii. Rightmost panel: star cluster candidate distribution overplotted on the combined F606W+F814W image, the dash-dotted line marks 2 Re, while the dashed line marks 3 Re. After applying these selection criteria, we identify 29 star cluster candidates within 3 Re of GAMA 526784.
Current usage metrics show cumulative count of Article Views (full-text article views including HTML views, PDF and ePub downloads, according to the available data) and Abstracts Views on Vision4Press platform.
Data correspond to usage on the plateform after 2015. The current usage metrics is available 48-96 hours after online publication and is updated daily on week days.
Initial download of the metrics may take a while.