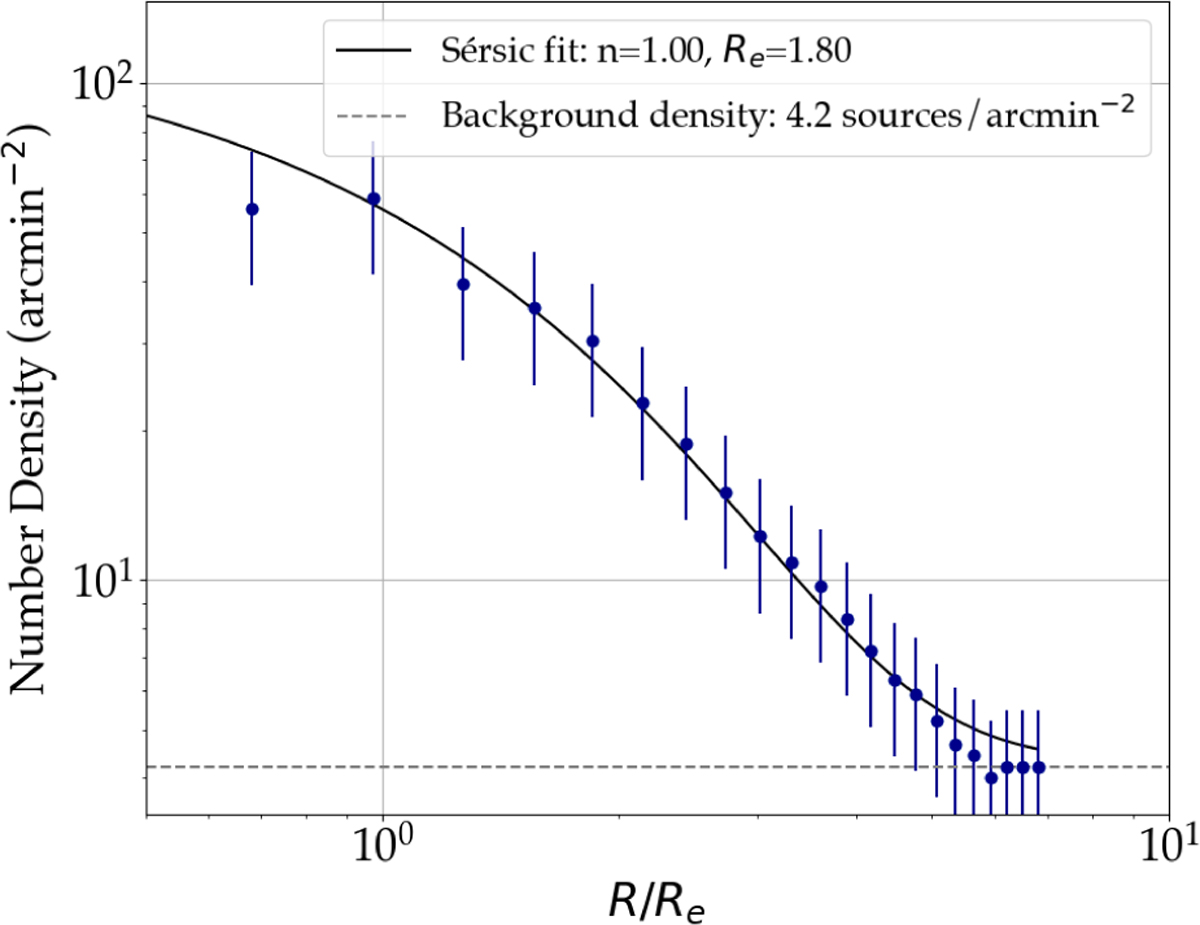
Fig. A.1
Download original image
Star cluster surface density profile around GAMA 526784 from galaxy centre in terms of Re. The blue scatter points and error bars are the measurements. The black curve is the Sérsic model fit to the total star cluster distribution. The dash-dotted grey line is the number density contribution of the background measured outside of 5 Re. This number density profile is calculated before selecting the clusters within 3 Re of GAMA 526784.
Current usage metrics show cumulative count of Article Views (full-text article views including HTML views, PDF and ePub downloads, according to the available data) and Abstracts Views on Vision4Press platform.
Data correspond to usage on the plateform after 2015. The current usage metrics is available 48-96 hours after online publication and is updated daily on week days.
Initial download of the metrics may take a while.