Fig. 9
Download original image
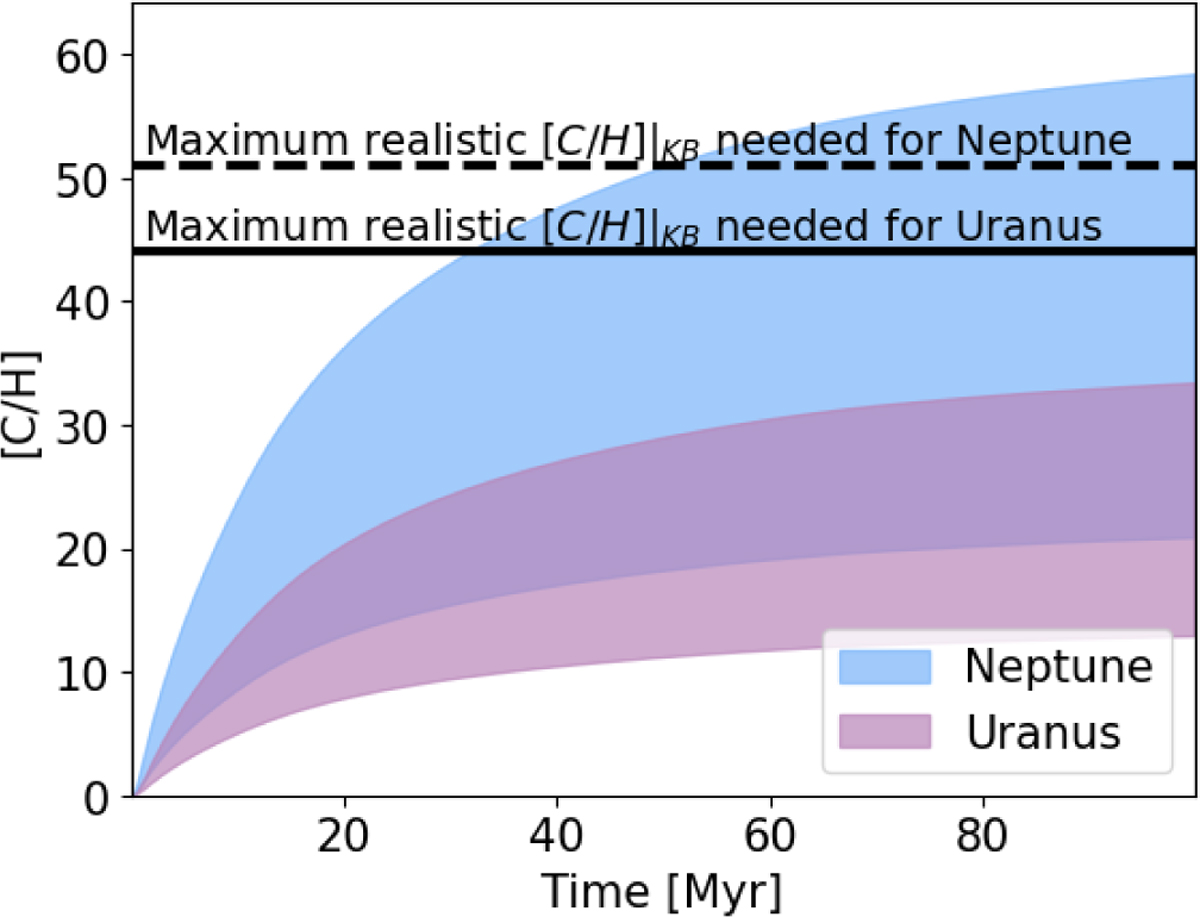
[C/H] for the HKB-fid simulation as a function of time. The filled areas correspond to predictions for Uranus (purple) and Neptune (blue). The uncertainties are shown via the extension of the filled areas and are due to uncertainties on the respective atmospheric masses. The solid and dashed black lines are the maximum estimation of the gas disc contribution obtained from observations for Uranus and Neptune (see Section 3.1.1).
Current usage metrics show cumulative count of Article Views (full-text article views including HTML views, PDF and ePub downloads, according to the available data) and Abstracts Views on Vision4Press platform.
Data correspond to usage on the plateform after 2015. The current usage metrics is available 48-96 hours after online publication and is updated daily on week days.
Initial download of the metrics may take a while.