Fig. 4
Download original image
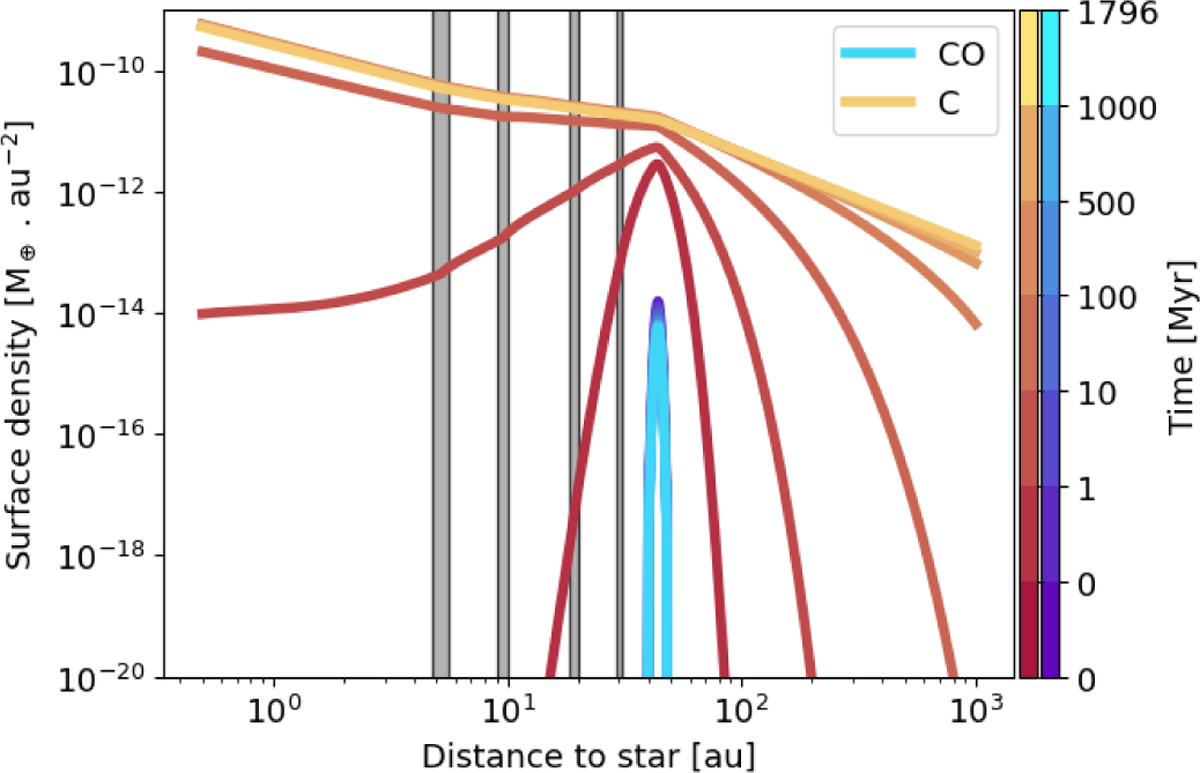
Surface density of CO (in variations of blue) and neutral carbon (in variations of orange) at different times for the LKB-fid simulation. The colour goes from darker to brighter for increasing time, as indicated by the colour bar. The grey vertical bars represent the planets’ accretion zones (from left to right: Jupiter, Saturn, Uranus, and Neptune).
Current usage metrics show cumulative count of Article Views (full-text article views including HTML views, PDF and ePub downloads, according to the available data) and Abstracts Views on Vision4Press platform.
Data correspond to usage on the plateform after 2015. The current usage metrics is available 48-96 hours after online publication and is updated daily on week days.
Initial download of the metrics may take a while.