Fig. 7
Download original image
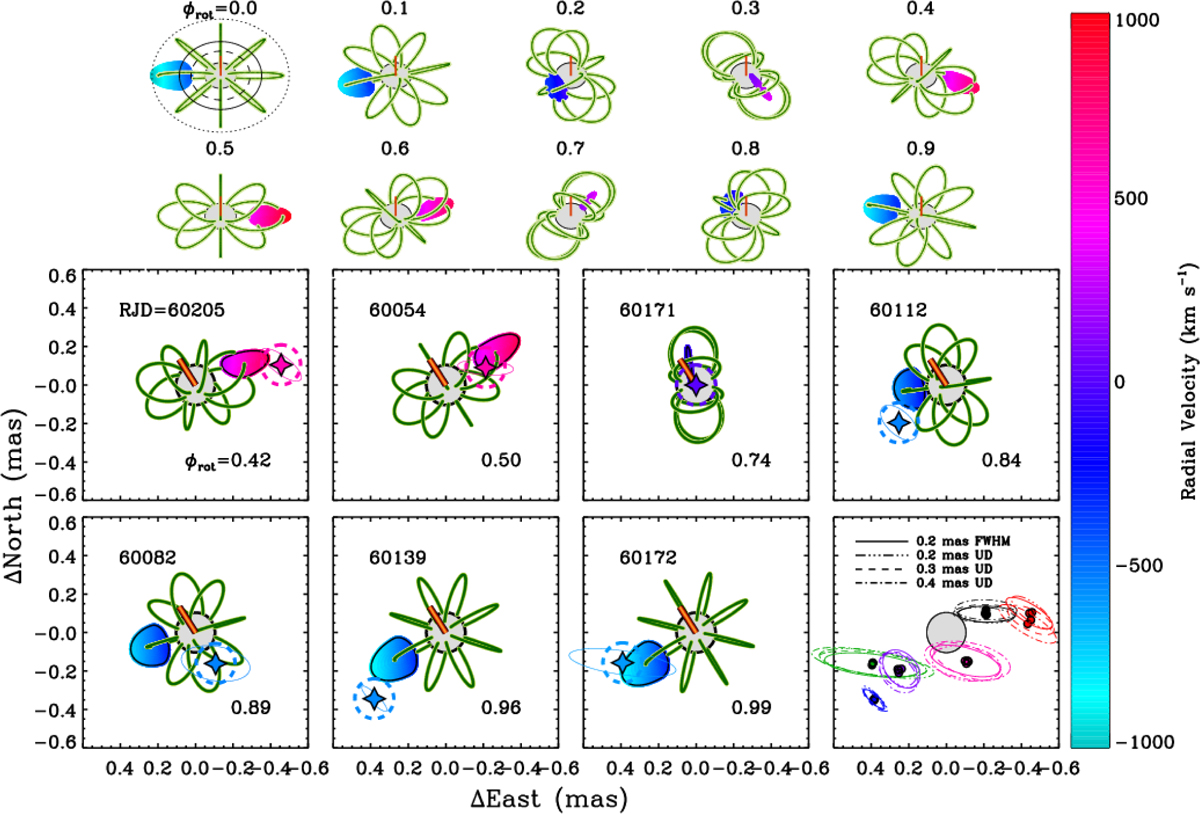
Top: model showing the projected position of the main magnetospheric cloud in rotational phase increments of 0.1. Cloud color indicates RV, as indicated by the color bar. The rotational axis is shown with the orange line. In the top left, dashed, solid, and dotted lines respectively indicate the Kepler corotation radius, the radius of maximum emission, and the outer extent of emission. Bottom: comparison of the expected location of the main magnetospheric cloud and the position recovered from the GRAVITY spectro-interferometry in Brγ. Astrometric locations are indicated by the star symbol, uncertainties in the position by error ellipses, and the assumed angular size of the cloud used in the fitting by the dashed circle. Bottom right: comparison of cloud positions and error ellipses inferred from different models: a Gaussian model with a 0.2 mas FWHM and UD models with radii of 0.2, 0.3, and 0.4 mas. Individual observations are color-coded. The adoption of different modeling assumptions has no significant influence on disk position or error ellipse properties.
Current usage metrics show cumulative count of Article Views (full-text article views including HTML views, PDF and ePub downloads, according to the available data) and Abstracts Views on Vision4Press platform.
Data correspond to usage on the plateform after 2015. The current usage metrics is available 48-96 hours after online publication and is updated daily on week days.
Initial download of the metrics may take a while.