Fig. 6
Download original image
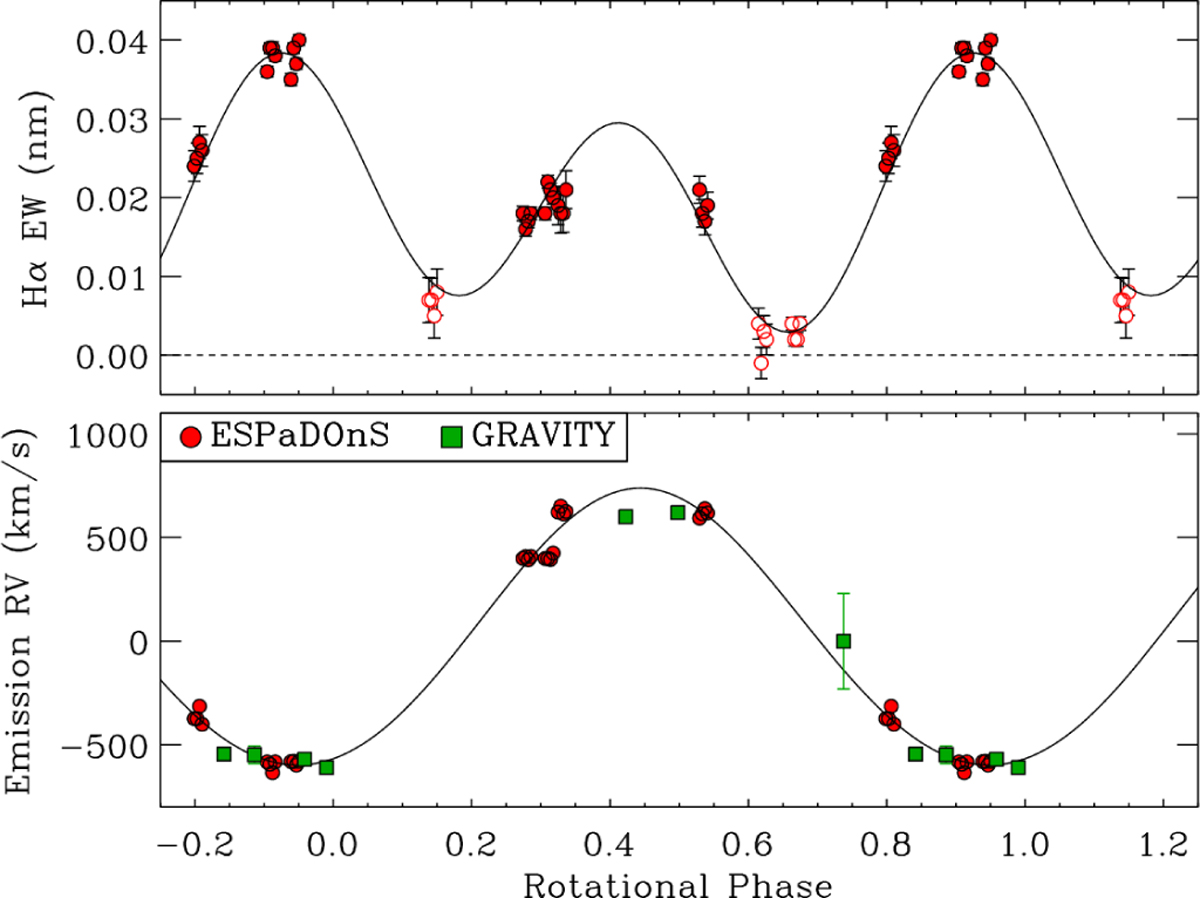
Top: Hα emission EW folded with the rotational period, demonstrating the double-wave character of the variation. The approximate continuum level corresponds to the null line. Points with no emission (from which useful RVs cannot be measured) are indicated by open circles. Bottom: RVs measured from the emission peaks of Hα and the RVs obtained from the Brγ line fitting, both folded with the rotational period. In both panels the black curve shows a harmonic fit to the ESPaDOnS data.
Current usage metrics show cumulative count of Article Views (full-text article views including HTML views, PDF and ePub downloads, according to the available data) and Abstracts Views on Vision4Press platform.
Data correspond to usage on the plateform after 2015. The current usage metrics is available 48-96 hours after online publication and is updated daily on week days.
Initial download of the metrics may take a while.