Fig. 3
Download original image
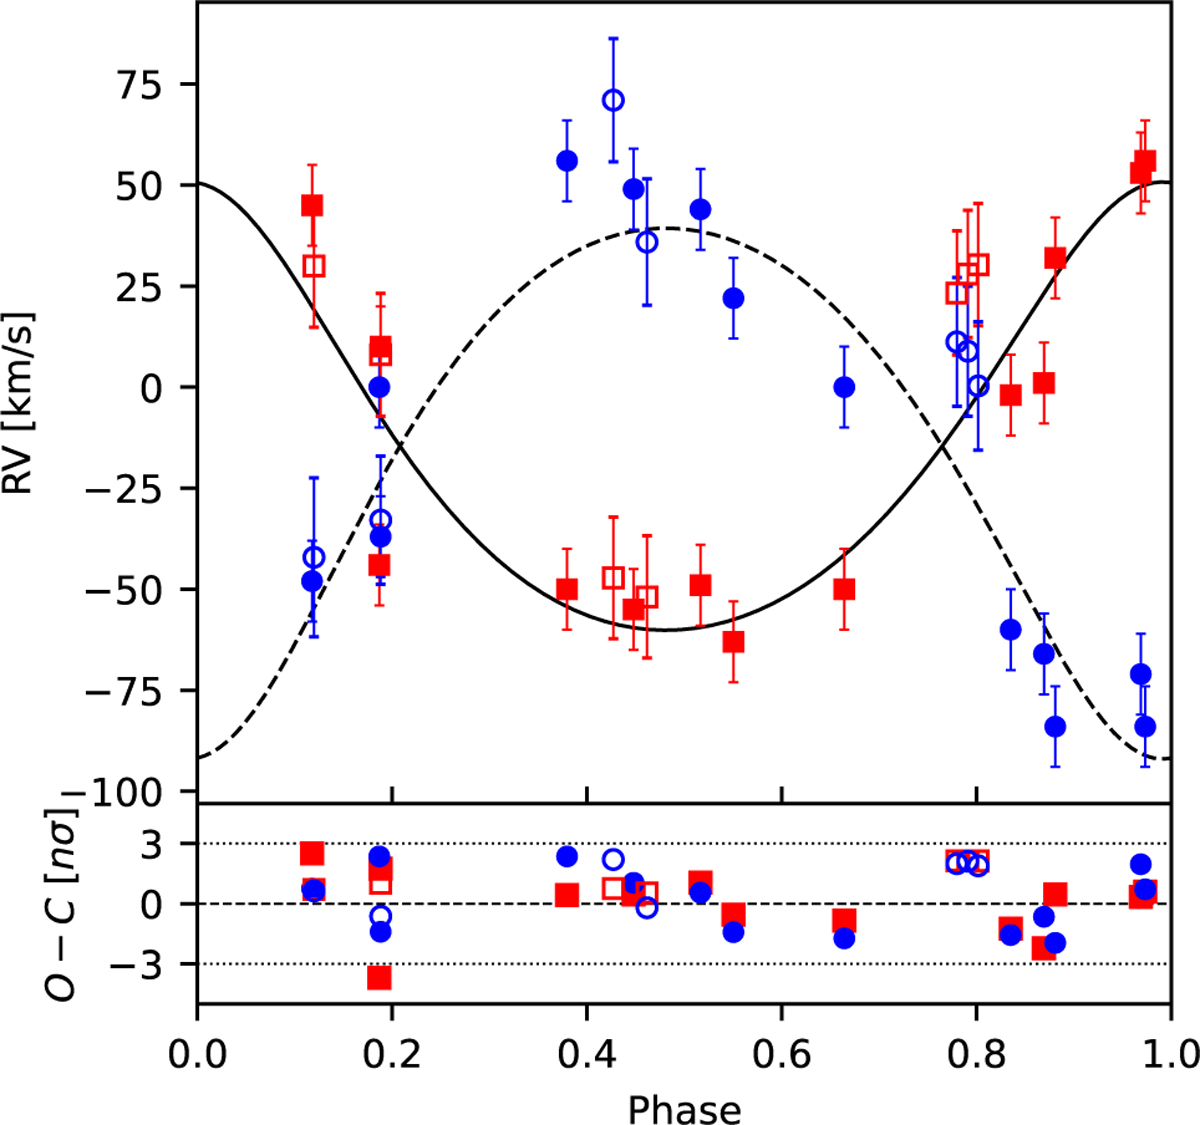
Top: computed RV curves of the Aa and Ab components (solid and dashed curves, respectively) overplotted with RVs for the Aa and Ab components measured by Shultz et al. (filled red squares and blue circles, respectively) and RVs measured from the Brγ signature in GRAVITY data (empty red squares and blue circles, respectively; see Sect. 4). The latter RVs were not used for the orbital solution and are shown only for comparison. Bottom: residuals in units of σ.
Current usage metrics show cumulative count of Article Views (full-text article views including HTML views, PDF and ePub downloads, according to the available data) and Abstracts Views on Vision4Press platform.
Data correspond to usage on the plateform after 2015. The current usage metrics is available 48-96 hours after online publication and is updated daily on week days.
Initial download of the metrics may take a while.