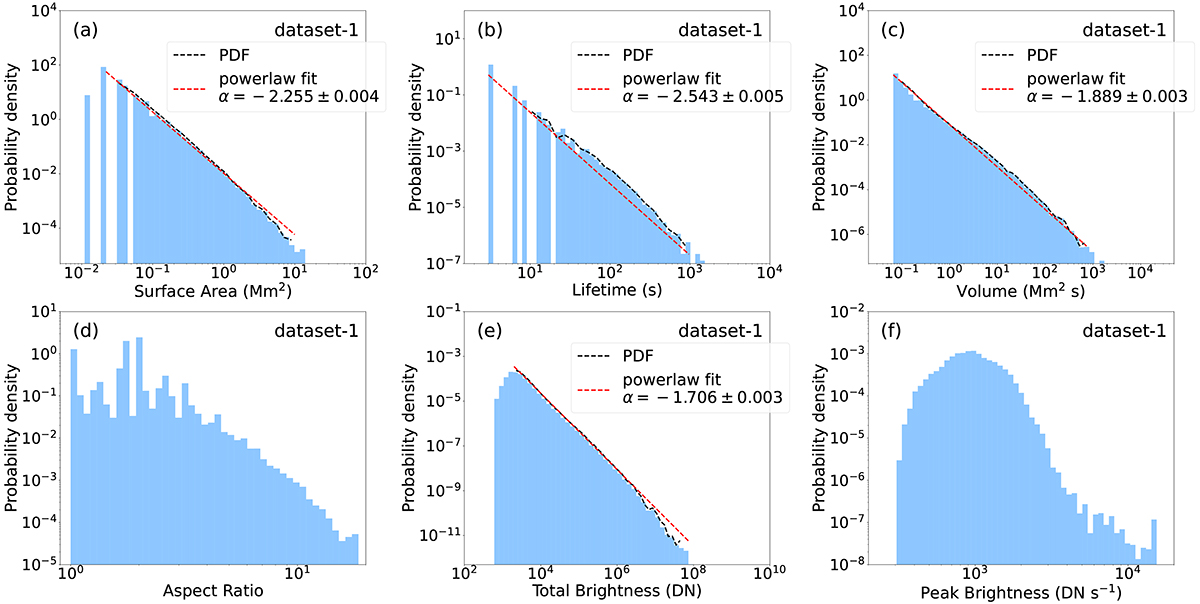
Fig. 4.
Download original image
Probability density distributions of properties of EUV brightenings for dataset-1. The probability density function (PDF) and power-law fit are shown for the distributions of surface area, lifetime, volume, and total intensity. The axes of all the plots are shown with a log10 scale. The corresponding figure for dataset-2 is shown in Appendix C.
Current usage metrics show cumulative count of Article Views (full-text article views including HTML views, PDF and ePub downloads, according to the available data) and Abstracts Views on Vision4Press platform.
Data correspond to usage on the plateform after 2015. The current usage metrics is available 48-96 hours after online publication and is updated daily on week days.
Initial download of the metrics may take a while.