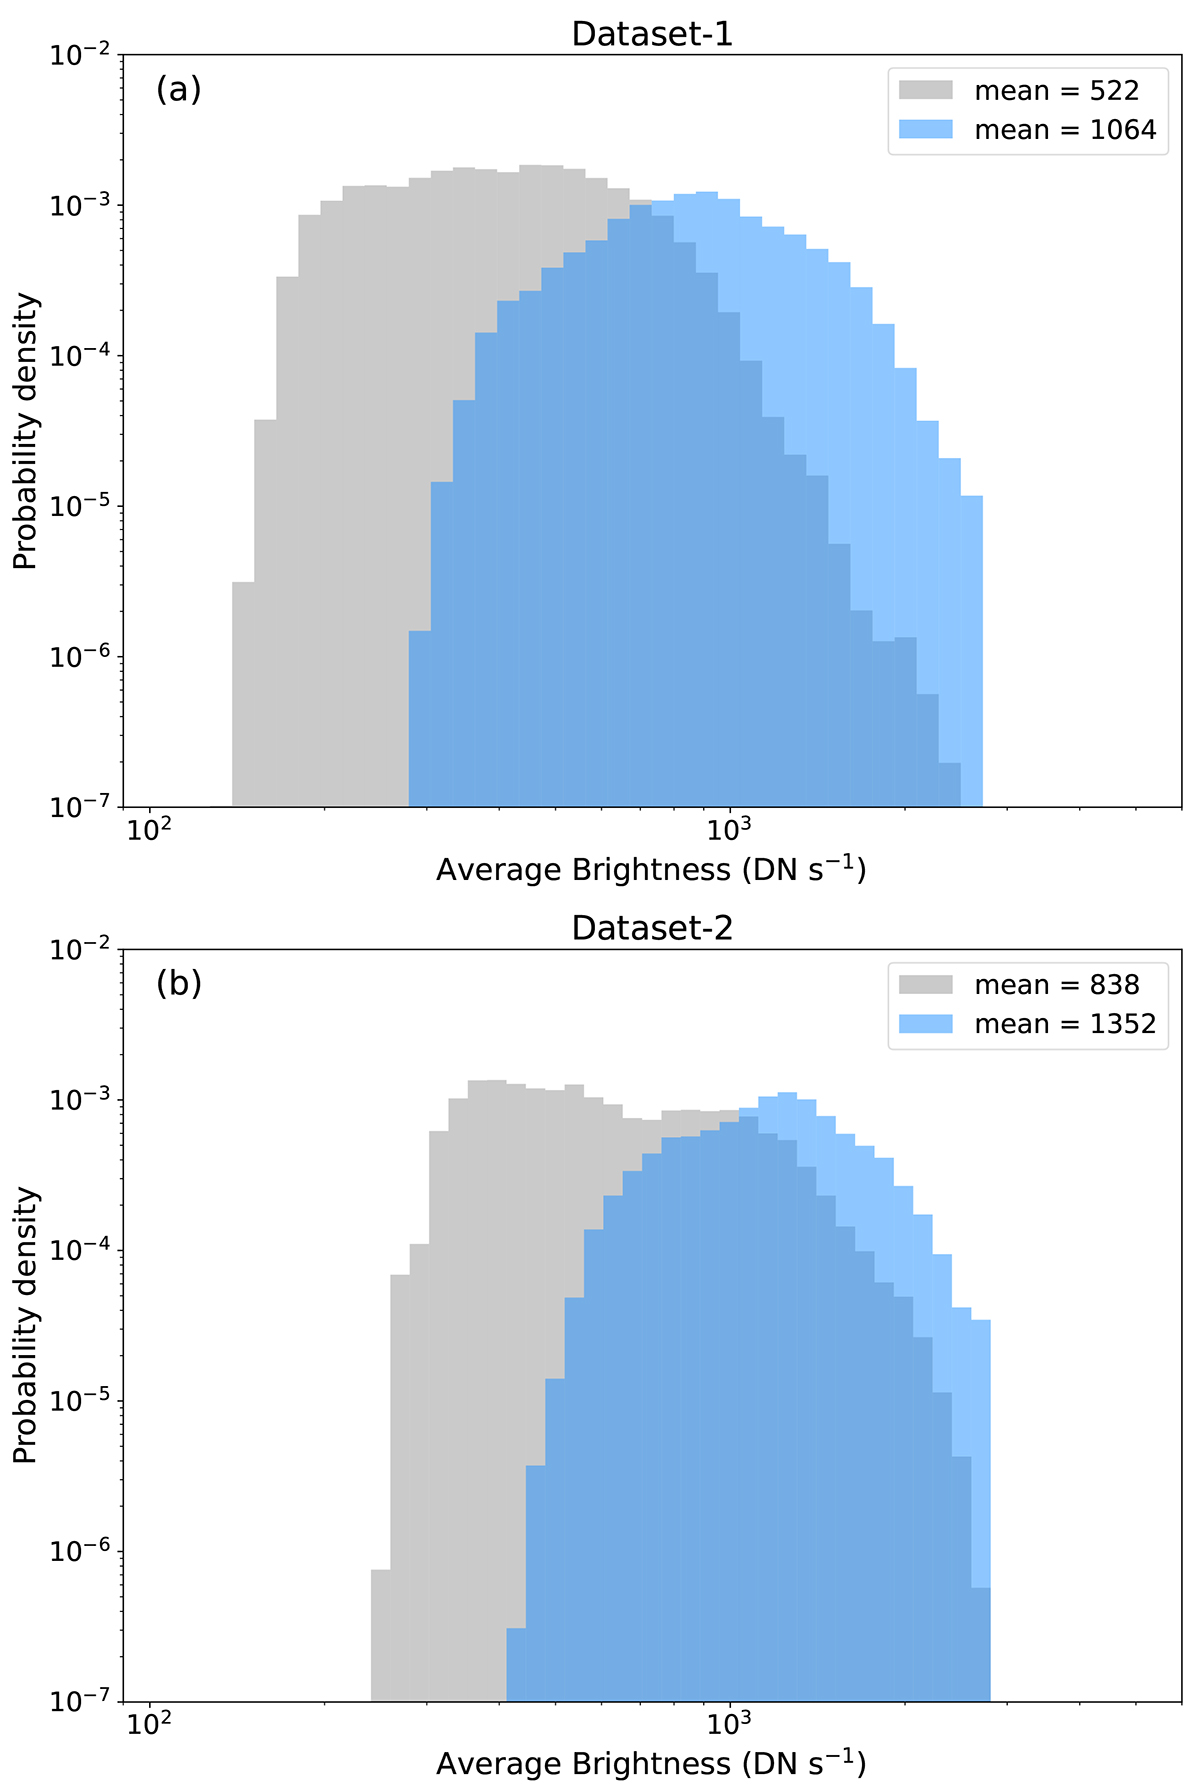
Fig. 3.
Download original image
Distributions of average brightness of EUV brightenings detected in the two datasets are shown in blue in each panel. Over-plotted are the respective distributions of pixel brightness of the temporally averaged FoV in grey. The overlapping region of the two distributions is shown in dark blue. The axes of both plots are shown with a log10 scale.
Current usage metrics show cumulative count of Article Views (full-text article views including HTML views, PDF and ePub downloads, according to the available data) and Abstracts Views on Vision4Press platform.
Data correspond to usage on the plateform after 2015. The current usage metrics is available 48-96 hours after online publication and is updated daily on week days.
Initial download of the metrics may take a while.