Fig. 5.
Download original image
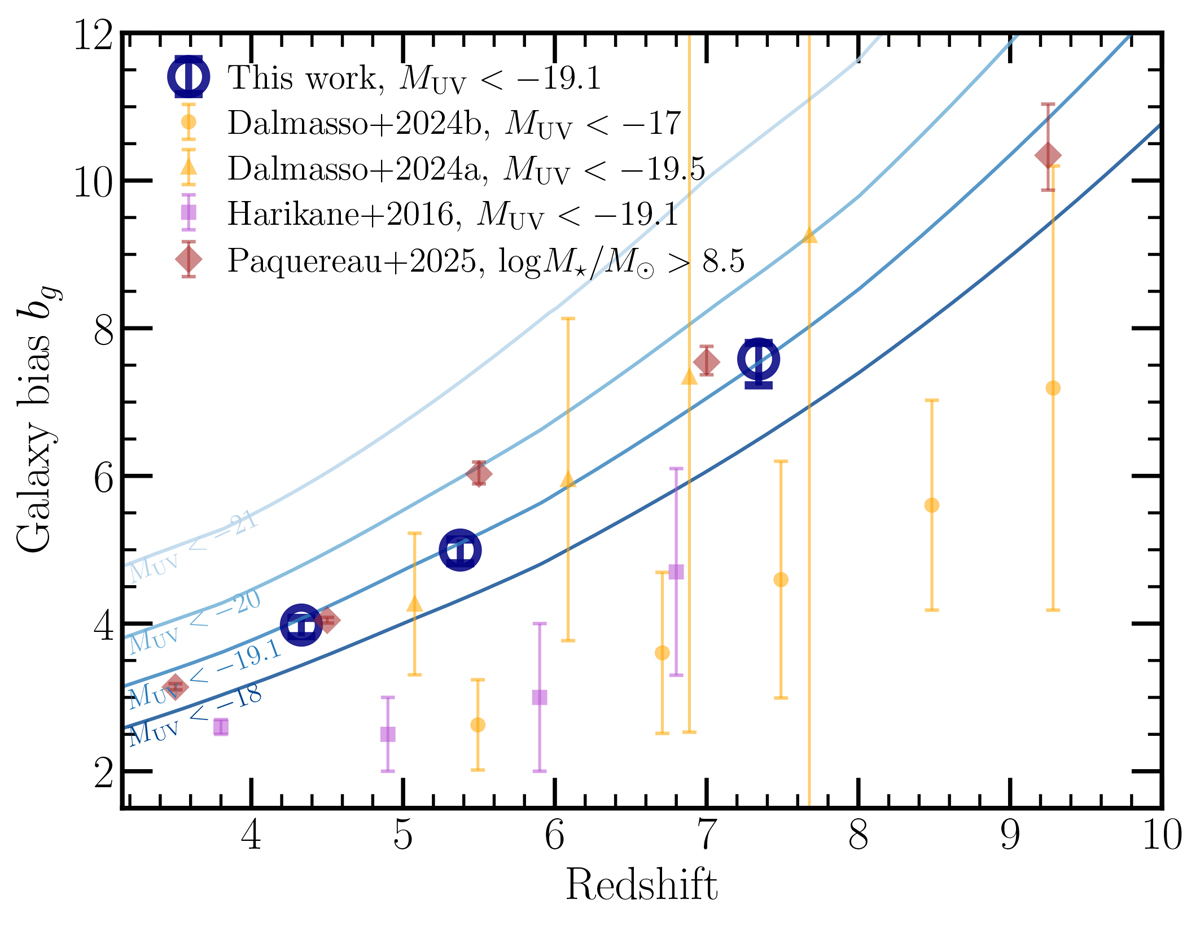
Galaxy bias as a function of redshift and MUV. The empty circles with error bars show the bias for the three line emitter samples Hα at z ∼ 4.3 and 5.4, and [O III] at z ∼ 7.3 with MUV < −19.1 mag. The solid blue lines show the bias as a function of redshift for four MUV thresholds computed from our model. We compare with measurements from Harikane et al. (2016), Dalmasso et al. (2024b) and Dalmasso et al. (2024a) for photometrically selected LBG, as well as Paquereau et al. (2025) for stellar mass selected, normal galaxies.
Current usage metrics show cumulative count of Article Views (full-text article views including HTML views, PDF and ePub downloads, according to the available data) and Abstracts Views on Vision4Press platform.
Data correspond to usage on the plateform after 2015. The current usage metrics is available 48-96 hours after online publication and is updated daily on week days.
Initial download of the metrics may take a while.