Fig. 1.
Download original image
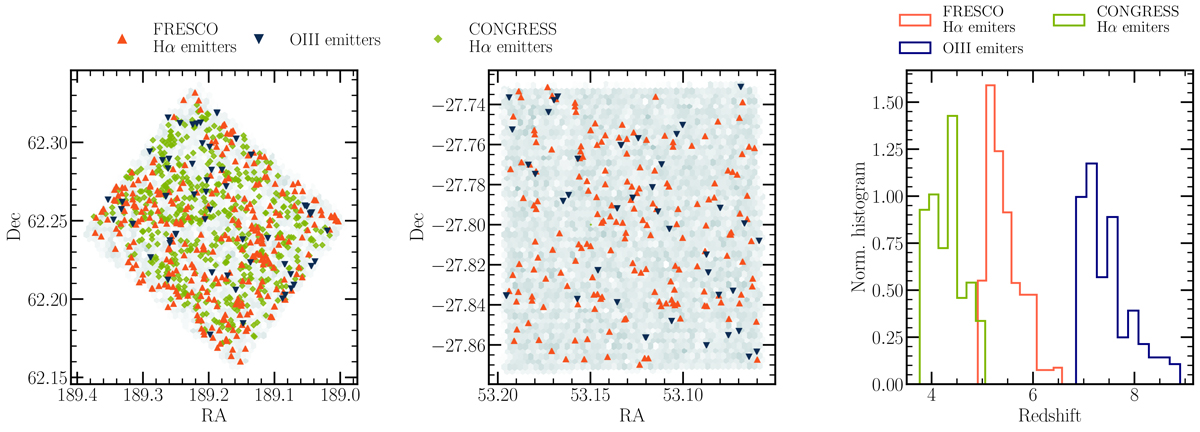
Spatial distribution of the three line-emitting samples (Hα and [O III] from FRESCO and Hα from CONGRESS) in the GOODS-North and GOODS-South footprints (left and middle panels) that we consider in this analysis. The right panel shows their redshift distribution. The density histogram gray background in the left and middle panels shows the footprint of the random catalogs.
Current usage metrics show cumulative count of Article Views (full-text article views including HTML views, PDF and ePub downloads, according to the available data) and Abstracts Views on Vision4Press platform.
Data correspond to usage on the plateform after 2015. The current usage metrics is available 48-96 hours after online publication and is updated daily on week days.
Initial download of the metrics may take a while.