Fig. 9.
Download original image
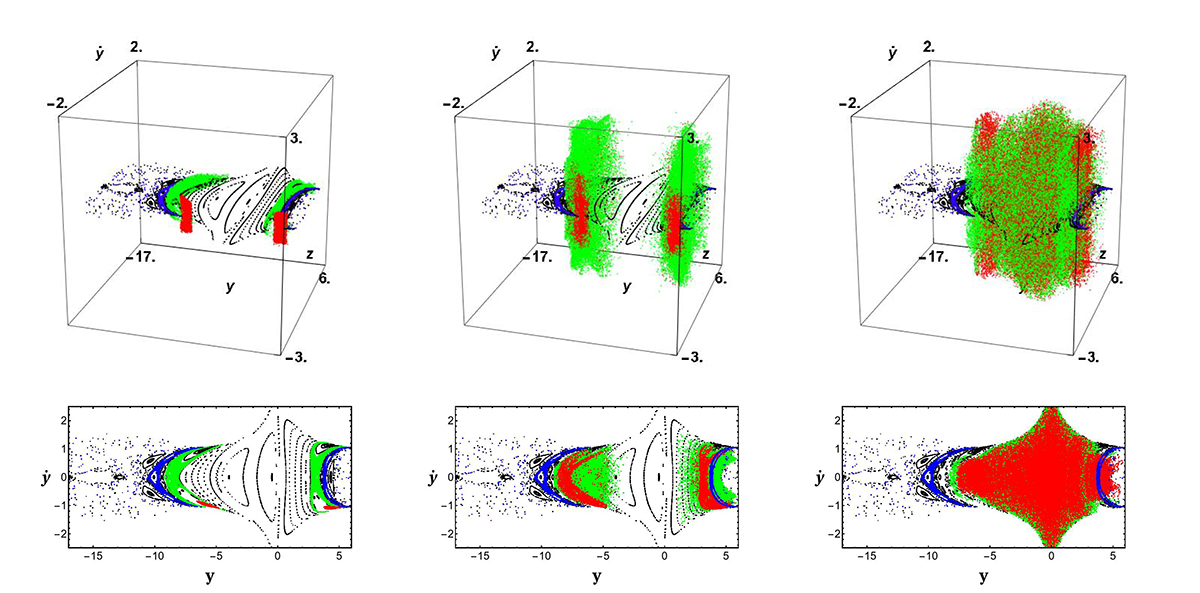
Top: 3D projection of the 4D PSS (![]() ) of the 3D chaotic orbits plotted in colour in Fig. 8. Top left: Orbits for the first 20 000 iterations. The red and green orbits behave as ordered ones for very long times, while the blue one is diffused out of the system more rapidly. Top middle: Orbits for iterations between 20 000 and 50 000. Top right: Orbits for the next 100 000 iterations. The time evolutions of the red and green sticky chaotic orbits present a very slow diffusion inwards. Bottom: Corresponding 2D projections of the 4D PSS for the same time periods. The 2D PSS of the planar orbits is shown in black, with the projections of the sticky 3D chaotic orbits presented above shown in colour.
) of the 3D chaotic orbits plotted in colour in Fig. 8. Top left: Orbits for the first 20 000 iterations. The red and green orbits behave as ordered ones for very long times, while the blue one is diffused out of the system more rapidly. Top middle: Orbits for iterations between 20 000 and 50 000. Top right: Orbits for the next 100 000 iterations. The time evolutions of the red and green sticky chaotic orbits present a very slow diffusion inwards. Bottom: Corresponding 2D projections of the 4D PSS for the same time periods. The 2D PSS of the planar orbits is shown in black, with the projections of the sticky 3D chaotic orbits presented above shown in colour.
Current usage metrics show cumulative count of Article Views (full-text article views including HTML views, PDF and ePub downloads, according to the available data) and Abstracts Views on Vision4Press platform.
Data correspond to usage on the plateform after 2015. The current usage metrics is available 48-96 hours after online publication and is updated daily on week days.
Initial download of the metrics may take a while.