Open Access
Fig. 1.
Download original image
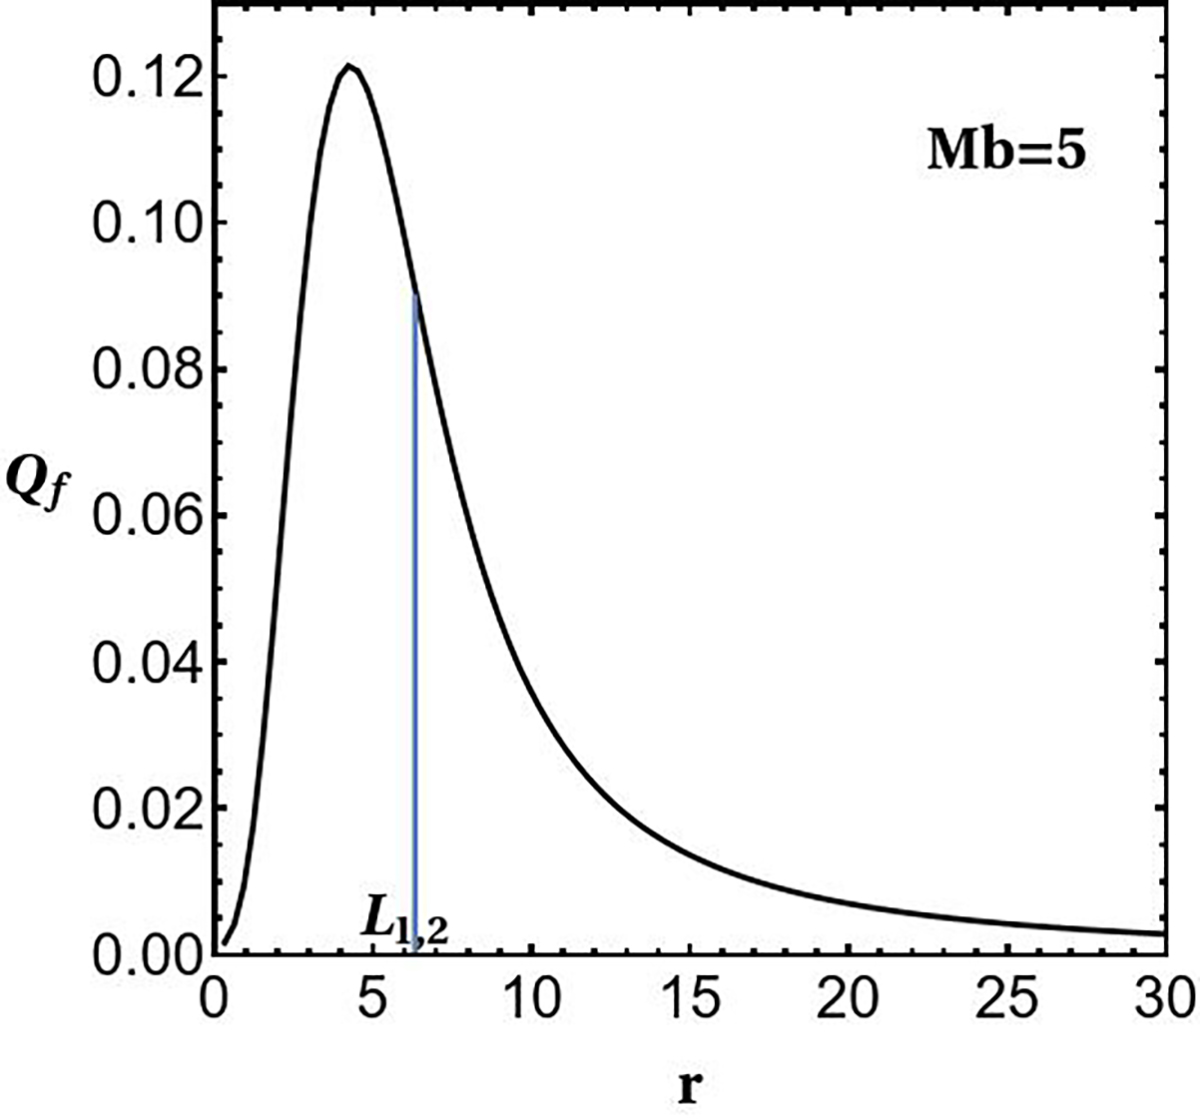
Q-force perturbation of the bar, Qf, as a function of the radius, r, of the bar. The maximum Qf is approximately 12%. The vertical line gives the position of the Lagrangian points L1, 2 that are located shortly after the end of the bar.
Current usage metrics show cumulative count of Article Views (full-text article views including HTML views, PDF and ePub downloads, according to the available data) and Abstracts Views on Vision4Press platform.
Data correspond to usage on the plateform after 2015. The current usage metrics is available 48-96 hours after online publication and is updated daily on week days.
Initial download of the metrics may take a while.