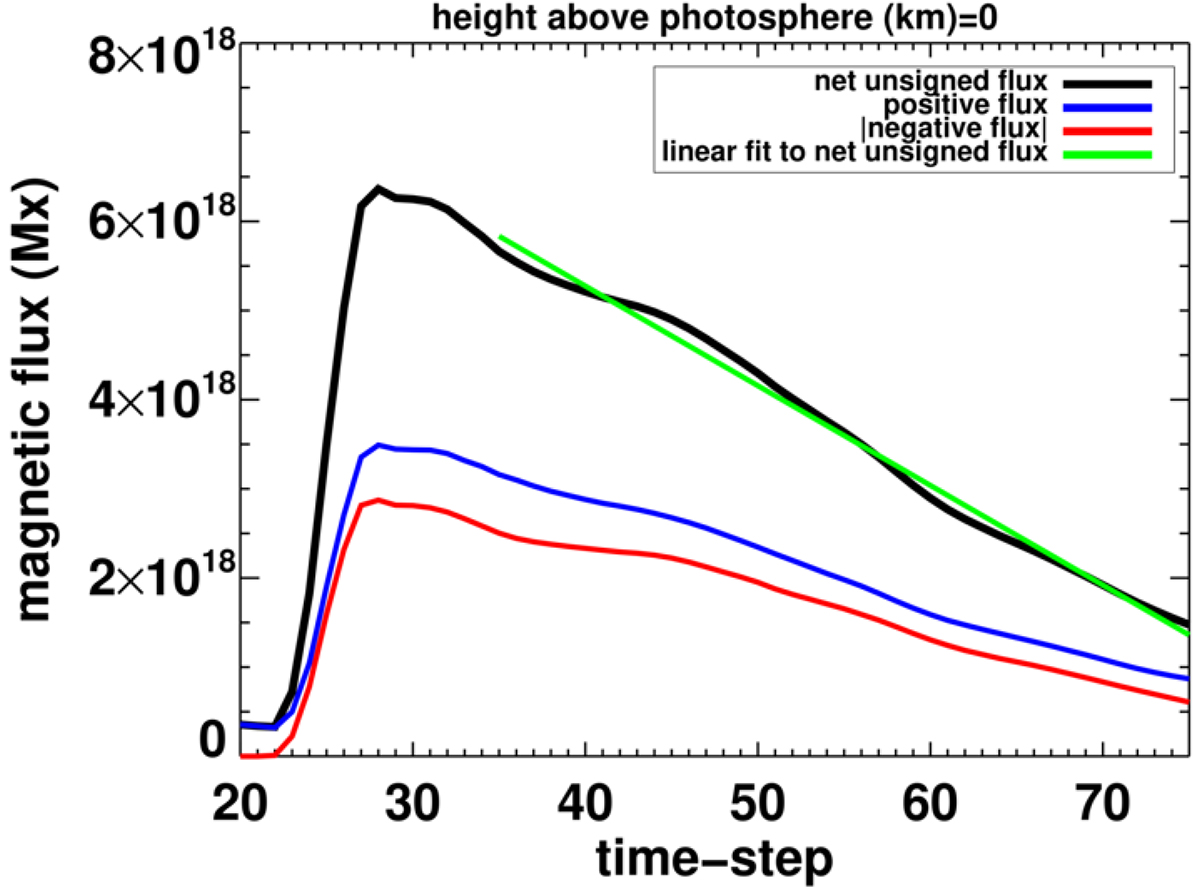
Fig. 6.
Download original image
Temporal evolution of the positive (blue line), negative (red line) and net unsigned photospheric magnetic flux (black line) in the green box of Fig. 3 shown from the appropriate column sums of the time-distance map of Fig. 5. The green line corresponds to a linear fit of the time-step and net unsigned flux pairs from time-step 35 onward. Consecutive time-steps are 86.9 s apart.
Current usage metrics show cumulative count of Article Views (full-text article views including HTML views, PDF and ePub downloads, according to the available data) and Abstracts Views on Vision4Press platform.
Data correspond to usage on the plateform after 2015. The current usage metrics is available 48-96 hours after online publication and is updated daily on week days.
Initial download of the metrics may take a while.