Open Access
Fig. 7.
Download original image
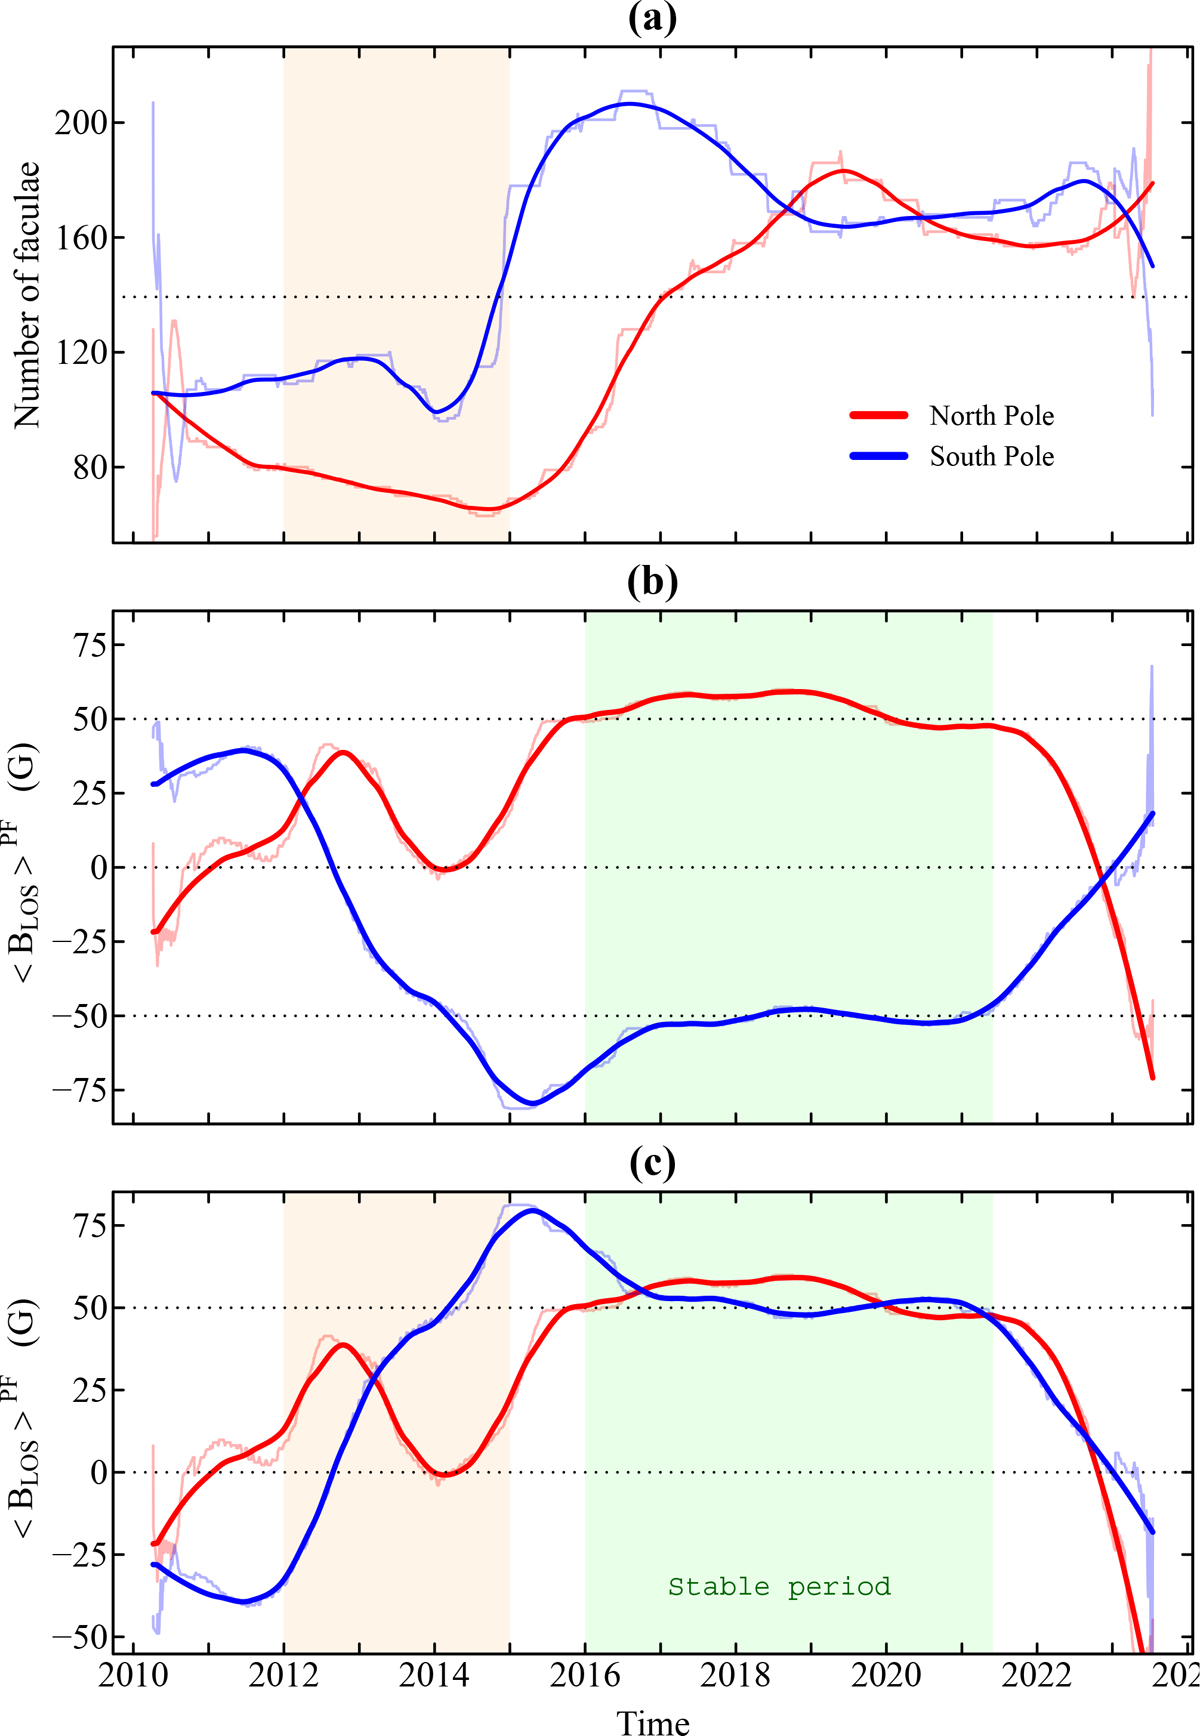
(a) Number of detected PFe over time for each pole and each recorded daily hour. (b) 〈BLOS〉PF of detected PFe over time for both solar poles. (c) Same plot as in panel b but changing the sign of the south pole 〈BLOS〉PF values. Measurements are plotted along with smoothed curves obtained by using polynomial fits.
Current usage metrics show cumulative count of Article Views (full-text article views including HTML views, PDF and ePub downloads, according to the available data) and Abstracts Views on Vision4Press platform.
Data correspond to usage on the plateform after 2015. The current usage metrics is available 48-96 hours after online publication and is updated daily on week days.
Initial download of the metrics may take a while.