Open Access
Fig. D.1.
Download original image
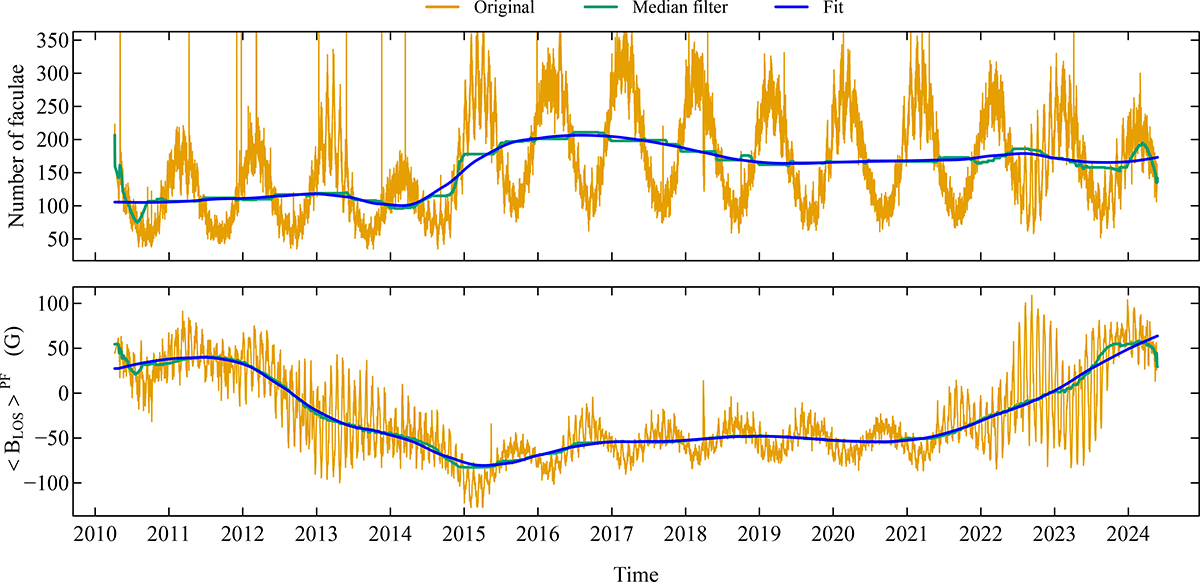
Top: Number of detected PFe over time at the Sun's south pole. Bottom: Daily mean BLOS of PFe over time at the Sun's south pole. The two graphs display the original raw values, the band-stop filter curve, its correction with a median filter, and a polynomial fit for values at 00:00 UTC.
Current usage metrics show cumulative count of Article Views (full-text article views including HTML views, PDF and ePub downloads, according to the available data) and Abstracts Views on Vision4Press platform.
Data correspond to usage on the plateform after 2015. The current usage metrics is available 48-96 hours after online publication and is updated daily on week days.
Initial download of the metrics may take a while.