Fig. 17.
Download original image
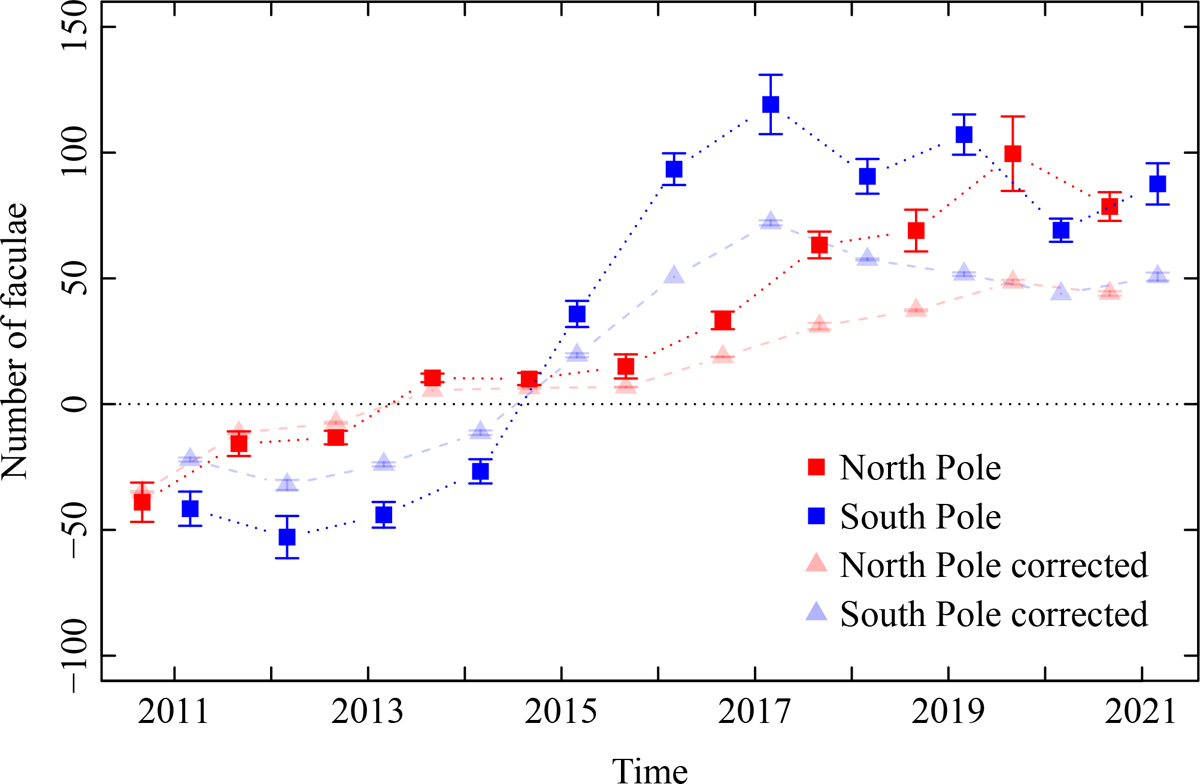
Annual average count of U-Net identified PFe (in solid color) without accounting for projection issues. The annual average was computed by taking the first week of September (for north pole) and March (for south pole) until 2021. Fainter color points shows projection-corrected measurements derived from an entire daily time series, and then taking averages of the first week of September and March as the end value. The sign was adjusted based on the sign of the average WSO polar magnetic field, following the method by Hovis-Afflerbach & Pesnell (2022). The polar regions under consideration were those with |φ⊙|≥70°.
Current usage metrics show cumulative count of Article Views (full-text article views including HTML views, PDF and ePub downloads, according to the available data) and Abstracts Views on Vision4Press platform.
Data correspond to usage on the plateform after 2015. The current usage metrics is available 48-96 hours after online publication and is updated daily on week days.
Initial download of the metrics may take a while.