Fig. 16.
Download original image
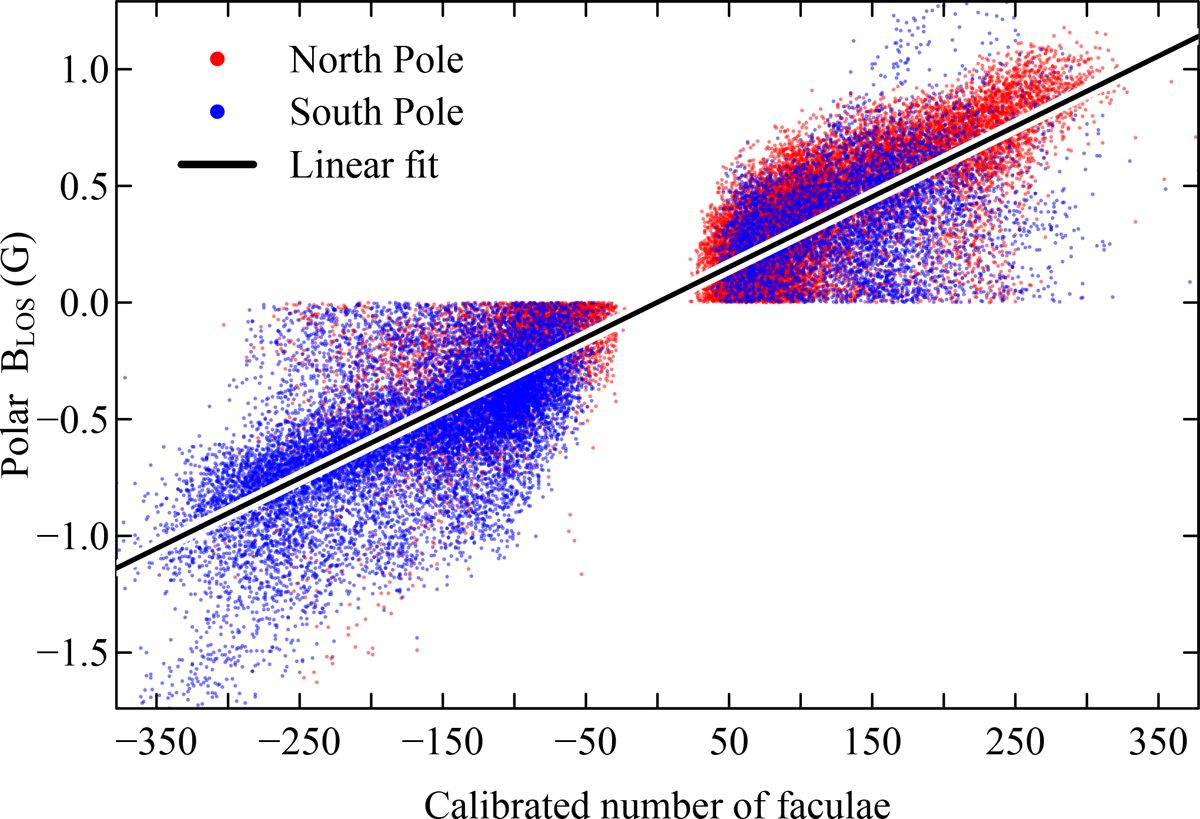
Averaged BLOS over the entire polar region as a function of the calibrated number of facule with the sign of the dominant polarity. A linear fit, y=ax+b, is also shown, where a = 0.003015±0.000007 G/facula and b = 0.0013±0.0011 G. The coefficient of determination is r2 = 0.82, and the Pearson correlation is 0.91. The fit includes all available data from 2010 to 2024.
Current usage metrics show cumulative count of Article Views (full-text article views including HTML views, PDF and ePub downloads, according to the available data) and Abstracts Views on Vision4Press platform.
Data correspond to usage on the plateform after 2015. The current usage metrics is available 48-96 hours after online publication and is updated daily on week days.
Initial download of the metrics may take a while.