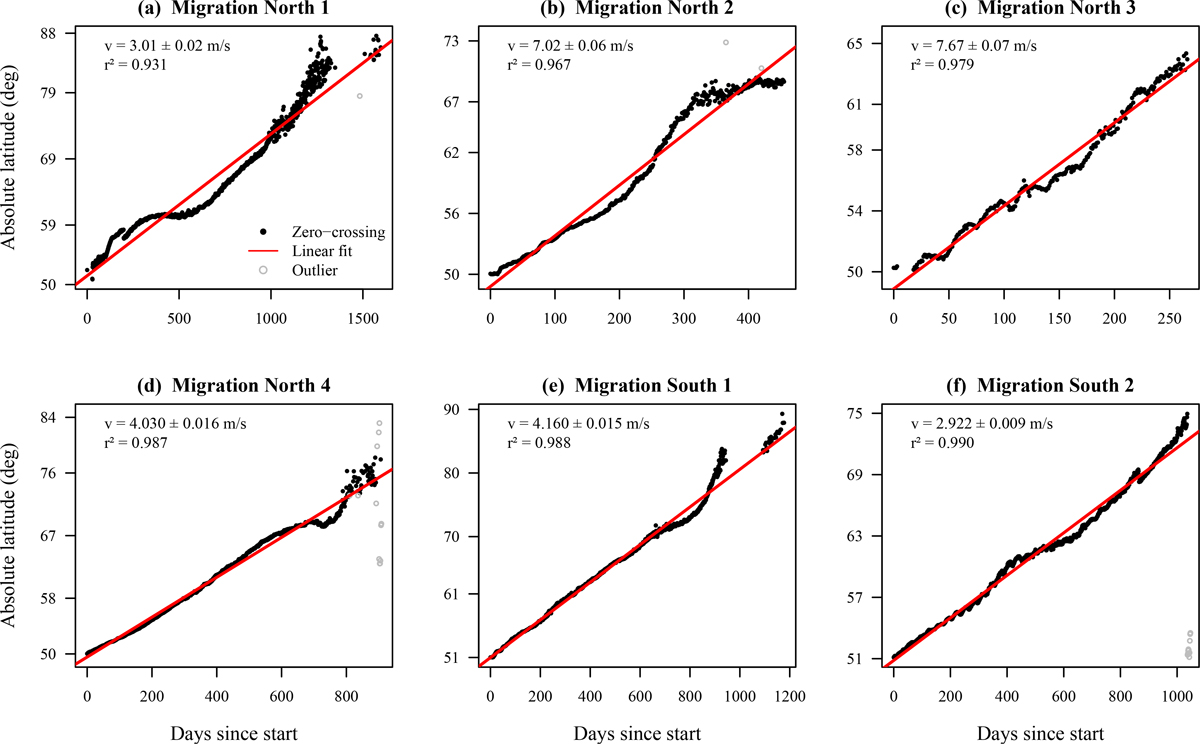
Fig. 14.
Download original image
Linear fits of polarity migration paths for the different regions of the solar poles indicated in Fig. 13. Each panel shows the absolute latitude of magnetic polarity inversions (zero-crossings) as a function of time. The time is calculated in days from the start of each migration at ±50°. Red lines represent linear regression fits, with the corresponding meridional flow velocities and r2 values indicated. Panels a–d show north pole migrations, while panels e and f show south pole migrations. Gray circles indicate outliers excluded from the fits.
Current usage metrics show cumulative count of Article Views (full-text article views including HTML views, PDF and ePub downloads, according to the available data) and Abstracts Views on Vision4Press platform.
Data correspond to usage on the plateform after 2015. The current usage metrics is available 48-96 hours after online publication and is updated daily on week days.
Initial download of the metrics may take a while.