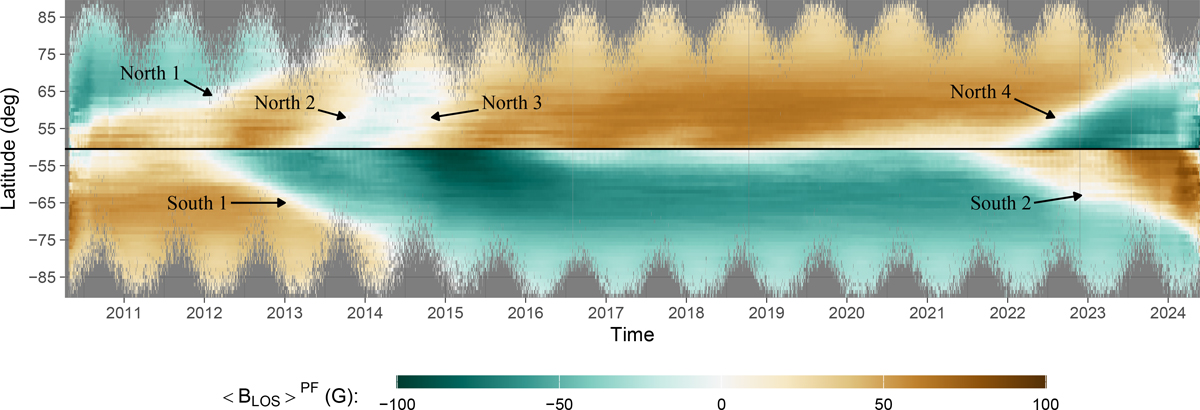
Fig. 13.
Download original image
Heatmap displaying the latitude plotted against time for each detected PF at 00:00 UTC. The color of each cell in the heatmap corresponds to the daily mean value of faculae's BLOS. Latitude has been discretized in intervals of 1° and BLOS values are restricted to the range [−100, 100] G. Additionally, there are six identified regions of polarity change, marked with text and arrows.
Current usage metrics show cumulative count of Article Views (full-text article views including HTML views, PDF and ePub downloads, according to the available data) and Abstracts Views on Vision4Press platform.
Data correspond to usage on the plateform after 2015. The current usage metrics is available 48-96 hours after online publication and is updated daily on week days.
Initial download of the metrics may take a while.