Fig. 1
Download original image
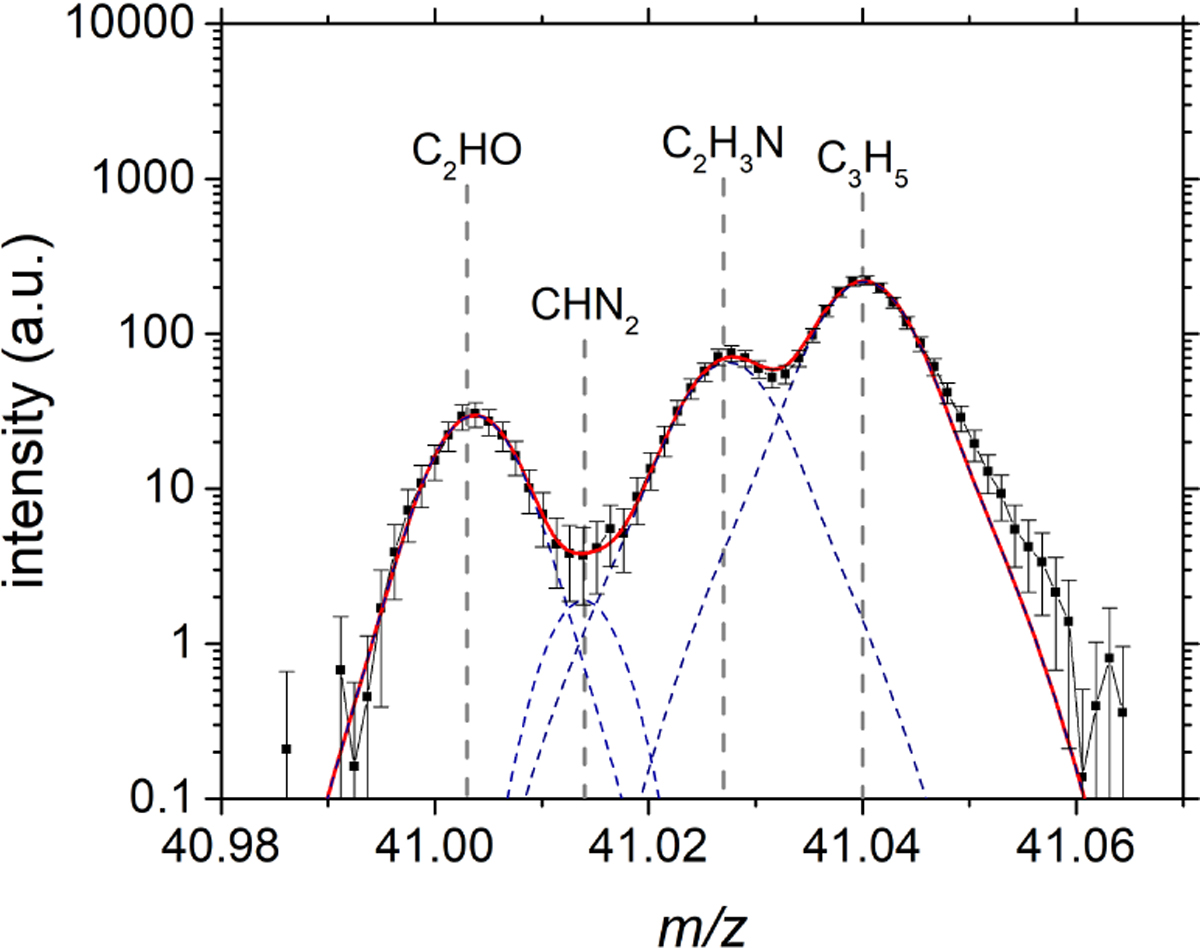
High-resolution mass spectrum collected on 3 August 2015 by the DFMS in 67P’s coma around m/z = 41 (black square markers). The peaks, associated with C3H5, C2H3N, CHN2, and C2HO at the exact positions indicated by the dashed grey lines, are normally fitted with double-Gaussian peak profile functions (dashed blue lines with the sum shown as a solid red line).
Current usage metrics show cumulative count of Article Views (full-text article views including HTML views, PDF and ePub downloads, according to the available data) and Abstracts Views on Vision4Press platform.
Data correspond to usage on the plateform after 2015. The current usage metrics is available 48-96 hours after online publication and is updated daily on week days.
Initial download of the metrics may take a while.